 An official website of the United States government.
 Official websites use .gov
A .gov website belongs to an official government organization in the United States.
Official websites use .gov
A .gov website belongs to an official government organization in the United States.
 Secure .gov websites use HTTPS
A lock or https:// means you’ve safely connected to the .gov website. Share sensitive information only on official, secure websites.
Secure .gov websites use HTTPS
A lock or https:// means you’ve safely connected to the .gov website. Share sensitive information only on official, secure websites.
This page serves to summarize each of the current COMT Projects. More info about the COMT can be found here. The overall COMT is managed by our non-federal partner, the Southeast University Research Association (SURA). SURA has a COMT website that can be found at testbed.sura.org. The 2013-2017 funded COMT projects include:
Chesapeake Bay Estuarine Hypoxia
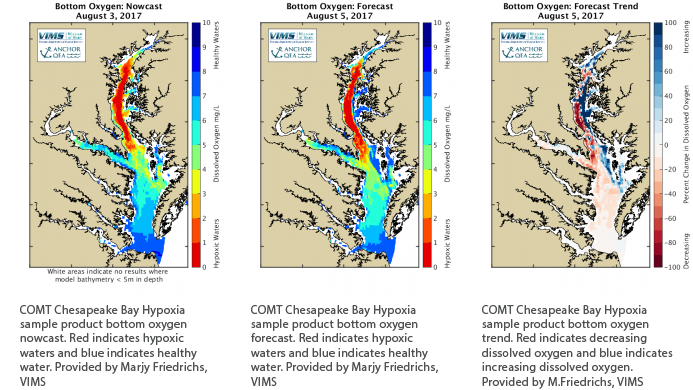
Hypoxia is a condition threatening the health of the Chesapeake Bay in which oxygen levels drop so low that fish and other animals are stressed or killed, and the incidents of hypoxia-causing 'dead zones' are on the rise.
Hypoxia in Chesapeake Bay occurs usually in the summer and is primarily the result of human activities that deliver nutrients such as nitrogen and phosphorus into the Bay, but new evidence from the testbed scientists suggest that wind forcing plays a significant role. The added nutrients support blooms of algae which in turn are decomposed by oxygen-depleting bacteria. The resulting hypoxia can suffocate animals that cannot move away, such as shellfish, and -- depending on how quickly the hypoxia develops -- either kill or force into less suitable habitat free-swimming animals such as fish, shrimp, and crabs.
This project is providing the modeling information that will enable best management practices and mitigation measures to be targeted in the Chesapeake Bay and on the human activities that have the most significant effect on decreasing nutrient transfer from land to coastal ecosystems.
The below figures represent sample products from the Hypoxia Forecast Tool (see www.vims.edu/hypoxia) that are being developed with stakeholder input from the recreational and commercial fishing communities of Chesapeake Bay. The COMT project is working with NOAA CO-OPS to transition these hypoxia forecasts to the Chesapeake Bay Operational Forecast System (https://tidesandcurrents.noaa.gov/ofs/cbofs/cbofs.html). In the future these products will also be hosted by the IOOS Mid-Atlantic Regional Association (MARACOOS).
Project Lead is Marjy Friedrichs, Virginia Institute of Marine Science.
Gulf of Mexico Shelf Hypoxia
A large hypoxic area (15,000 km2 on average; the largest in U.S. coastal waters) forms every summer over the Texas-Louisiana shelf in the northern Gulf of Mexico due to decay of organic matter that is primarily derived from nutrient inputs from the Mississippi/Atchafalaya River System. Interannual variability in the size of the hypoxic region is large. The 2008 Action Plan (Hypoxia Taskforce, 2008) put forth by the Mississippi River/Gulf of Mexico Watershed Nutrient Task Force, an alliance of multiple state and federal agencies and tribes, calls for a reduction of the size of the hypoxic zone to a running 5-year mean of 5,000 km2 through nutrient management in the watershed. The goals of this project are to:
1. Assess the skill at predicting currents, temperature and salinity (including stratification) of the TAMU ROMS shelf model – Not nested –Nested within the NOAA CSDL NGOM (POM) –Nested within the NRL IASNFS (NCOM) –Nested within the NRL/FSU GoM (HYCOM) This approach allows a four way test bed for skill assessment between a stand-alone shelf model and the same model nested within three basin models using the same data and comparable evaluation techniques.
2. Assess the skill at predicting biogeochemical distributions of the coupled Fennel/ ROMS model –Not nested –Nested within the NOAA CSDL NGOM (POM) –Nested within the NRL IASNFS (NCOM) –Nested within the NRL/FSU GoM (HYCOM) This approach allows evaluation of the ecosystem model consistent with the hydrodynamic model evaluation. 2b. Assess the skill at predicting oxygen distributions of the coupled Fennel/ ROMS model and the coupled EPA GEM-Ko/ NCOM model both nested with the NRL IASNFS. This approach allows cross comparison of two hypoxia model approaches.
3. Evaluate and transition (from pre-operations to operations) the 3 km AMSEAS (NCOM) nowcast/forecast system; Provides near-term operational capability relevant to both future operational hypoxia applications as well as: –real-time Coast Guard search and rescue operations –harmful algal bloom tracking –oil spill response applications * This approach facilitates the transition of NGI Developmental OceanNOMADS to NOAA NCDDC OceanNOMADS, and the planned NODC version of NCDC National Operational Model Archive and Distribution System.
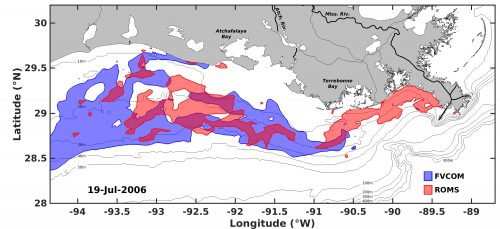
A comparison of the hypoxic area in FVCOM and in ROMS. The two model use the same simple oxygen model. Image credit: Arnaud Laurent
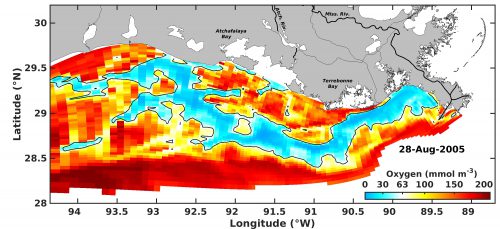 Simulated bottom oxygen distribution with ROMS. The black line indicates the limit of the hypoxic area (in light blue)Image credit: Arnaud Laurent |
Project Lead is Katja Fennel, Dalhousie University, Halifax.
US West Coast Model Intercomparison Project
The US West Coast component of the Coastal Ocean Modeling Testbed brings together researchers involved in coastal ocean modeling, data assimilation, and prediction with the goal to improve existing prediction systems and compare performance of different models and data assimilation approaches. The existing real-time forecast systems, supported by NOAA IOOS regional observing systems, include (1) the Oregon-Washington system run by a group at Oregon State University as part of NANOOS, (2) the LifeOcean system focused on the Washington coast and run at the University of Washington, supported by NANOOS and the State of WA, (3) the California system run by RSSI supported by CeNCOOS and SCCOOS, and (4) the regional West Coast system run at the University of California – Santa Cruz, supported by CeNCCOOS. These efforts include different approaches to data assimilation and three different biogeochemical models.
The metrics for skill assessment and the best practices for data assimilation and coupled physical-biogeochemical modeling are transitioned to the West Coast Ocean Forecast System that is being developed and tested at NOAA CSDL and implemented in the near real-time by NOAA CO-OPS.
System evaluations, comparisons, and improvements:
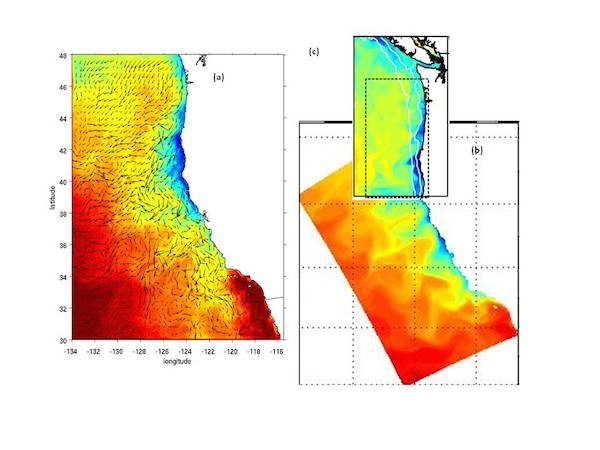
Computational domains of three ocean forecast systems operating off the US West Coast through IOOS: (a) the 10-km resolution West Coast model, 4DVAR, (b) the 3-km CA model, 3DVAR, (c) the 2-km resolution OR-WA model, 4DVAR. The color is SST (different periods in August are shown within each domain, the range of colors is approximately from 8 to 20oC). Image credit: (a) C. Edwards, (b) Y. Chao, and (c) A. Kurapov.
(i) Forecasts provided by our three model systems (see Figure below) will be compared to available in-situ and satellite observations. Inter-model comparisons will be done for our three models and will then be extended for global and regional operational NOAA and Navy forecast products, including Navy HYCOM (Bub) and NOAA NCEP RTOFS (Mehra), as well as regional Navy products.
(ii) Three existing NPZ-type biogeochemical models (already integrated in ROMS), including the 6-component NPZDO (Banas; Banas et al., 2009), the 11-component NEMURO (Edwards, Moore; Kishi et al. 2007), and the 31-component CoSiNe (Chai et al., 2002; Dugdale et al., 2002) will be compared to each other and to available data, using the COMT testbed tools. The practicality of developing a unified biogeochemical model across all three regions and a multi-model ensemble will be evaluated.
(iii) Effects of different boundary conditions (climatology, Navy HYCOM, RTOFS) on accuracy of coastal ocean forecasts (CA and OR-WA) will be evaluated.
(iv) The OR-WA 4DVAR system will be tested with a new (ensemble-based) model error covariance suitable for anisotropic ocean conditions in the presence of the Columbia River (Kurapov).
(v) The Ensemble Kalman Filter assimilation method will be implemented into the CA model and results will be compared to 3DVAR (Cornuelle).
(vi) Observing system simulation experiments (OSSE) will be performed for the regional UCSC model using observation sensitivity and observation impact tools developed for ROMS (Moore).
Project Lead is Alex Kurapov, Oregon State University.
2017 COMT Annual Meeting: West Coast Project Report
2017 COMT Annual Meeting: West Coast California Current Obs System Report
2016 COMT Annual Meeting: West Coast Operational Forecast System Report
2016 COMT Annual Meeting: West Coast California Current Obs System Report
Puerto Rico/ Virgin Islands Surge and Wave Inundation
The goal of this COMT project is to extend the present wave/surge operational forecasting capability from mild-sloped coastal areas such as the US East and Gulf of Mexico coasts to steep-sloped areas such as around Caribbean and Pacific islands and transition this capability to NOAA’s National Hurricane Center and local WFOs. Project objectives are to: (1) compile a data set of observations collected around Puerto Rico and the USVI by the IOOS Caribbean Regional Association; (2) evaluate multiple, coupled wave/surge/inundation models against this data; (3) recommend the most suitable model for transition to operations and (4) assist with the transition. These outcomes will also be applicable to U.S. island regions in the Pacific and may therefore guide future implementations at NOAA’s Central Pacific Hurricane Center.
U.S. island regions in the Caribbean and Pacific pose many challenges to the accurate modeling and prediction of hazardous wave-dominated storm surge inundation events. The relative importance of physical processes leading to inundation in steep-sloped, reef-edged island environments differs from those in milder-sloped mainland environments. Relatively little research has been done in these environments, constituting a significant knowledge gap. To compound this uncertainty, little observational data are available in many island environments. As a result, the U.S. National Weather Service (NWS) currently lacks operational surge and inundation guidance for these regions. An exception to this general data scarcity is Puerto Rico and the U.S. Virgin Islands (USVI), which frequently experience strong tropical and extra-tropical storms resulting in high waves, storm surge, and river flooding. A large number of observational instruments have been deployed here, many by IOOS Caribbean Regional Association partners, creating a valuable resource for the evaluation and advancement of operational wave/surge/inundation models of these areas.
Three teams - an operational assessment team (federal user group), a numerical modeling team and a data management team - will work together to accomplish the following tasks:
- Model, test case and metric selection: All teams jointly define desired operational inundation model improvements in Puerto Rico and USVI, and identify candidate models to meet those needs. The data team selects test cases for model evaluation and compiles these into an islands inundation data set, compliant with the COMT’s Cyber-Infrastructure standards. All teams jointly define a set of metrics for model evaluation and comparison.
- Model comparison over reef transects: The modeling team performs detailed cross-reef simulations with coupled spectral wave and hydrodynamic models to evaluate performance on a physics process basis. Results are compared with observations and against phase-resolving wave models (which are too expensive for operational use, but will provide useful benchmark results).
- Model comparison for regional field cases: The modeling team performs model evaluations over complex regional field cases, featuring hurricane meteorological forcing, high-resolution bathymetry and topography, roughness values derived from benthic maps and rainfall run-off inputs. Model performance will be compared for accuracy and computational requirements.
Final evaluation, recommendations and dissemination: All teams will compile joint recommendations regarding the most suitable model or models for near-term and long-term operational implementation. Recommendations will also be made regarding current and future observational networks and field campaigns. All teams will provide assistance in the transition of the recommended model, incl. setting up COMET web-based training materials, if required.
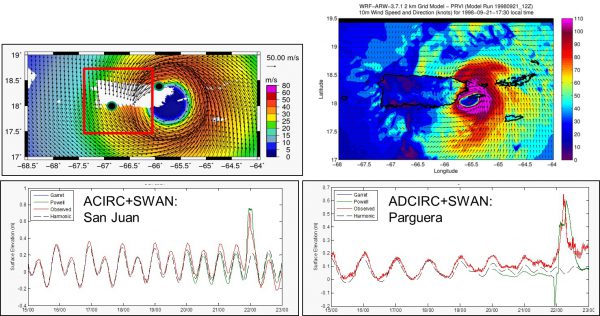
This demonstrates model sensitivity to wind forcing and shows wind speed overestimation by parametric model causes exaggerated set-down at Parguera. Image credit: Juan Gonzalez-Lopez, UND/CariCOOS
Project Lead is Andre van der Westhuysen, NOAA Affiliate.
2017 COMT Annual Meeting: Puerto Rico/US Virgin Islands Inundation Report
2016 COMT Annual Meeting: Puerto Rico/US Virgin Islands Inundation Report
Cyberinfrastructure
Visualization and Data Access Services for COMT Model and Data Archive:
SciWMS is a Python-based set of visualization services (OGC WMS) including support for structured and unstructured grids – this prototype is working with FVCOM and ADCIRC and will be extended to other models. SciWMS image below for Ruoying He's model rendered directly from a DAP server.
The goal of this project is to improve the function and performance of SciWMS so it can be used to visualize all compliant model results and observational data stored on the COMT archive server and to develop a SciWMS based web client to perform the visualization. All related source code will be archived and made available via github. Documentation and deployment tools will be created to allow IOOS RA’s and others to rapidly deploy similar SciWMS-based web clients to visualize compliant data on other Thredds servers.
The project includes 3 major tasks:
- Develop, demonstrate and make available a web client to allow users to browse and visualize compliant model results and observational data in the COMT archive.
- The web client will access the catalog of model and observation data harvested by the GeoPortal catalog hosted by NGDC.
- Complete SciWMS improvements and documentation and make SciWMS available to the community. SciWMS provides visualization of model grids, including unstructured model grids such as FVCOM.
See the current visualization system at comt.ioos.us.
 CI Visualization close up of PR/USVI Inundation using developed tools. Image credit: COMT CI/RPS ASA |
 CI Visualization of PR/USVI Inundation using developed tools. Image credit: COMT CI/RPS ASA |
Project Lead is Eoin Howlett, RPS-ASA.