An official website of the United States government.
 Official websites use .gov
A .gov website belongs to an official government organization in the United States.
Official websites use .gov
A .gov website belongs to an official government organization in the United States.
 Secure .gov websites use HTTPS
A lock or https:// means you’ve safely connected to the .gov website. Share sensitive information only on official, secure websites.
Secure .gov websites use HTTPS
A lock or https:// means you’ve safely connected to the .gov website. Share sensitive information only on official, secure websites.
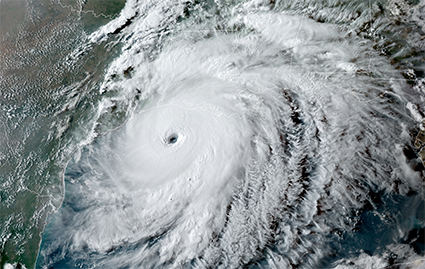
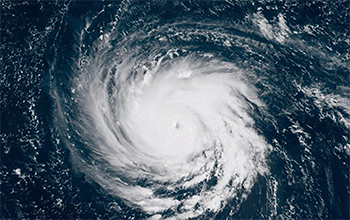
Tropical cyclones are one of the costliest and deadliest natural hazards affecting the U.S. While NOAA has significantly improved hurricane track forecasts over the last few decades, intensity forecast improvements have lagged in comparison. Warm ocean waters provide the fuel for tropical cyclones and can have a major impact on their intensity. Unexpected rapid intensification of tropical cyclones in the hours before landfall can catch coastal communities off guard with deadly consequences, while unexpected rapid weakening can erode public trust in forecasts and evacuation guidance, and can lead to costly and unnecessary evacuations. Local governments and decision-makers need accurate hurricane forecasts to make cost-effective preparation and evacuation decisions that impact human life and property.
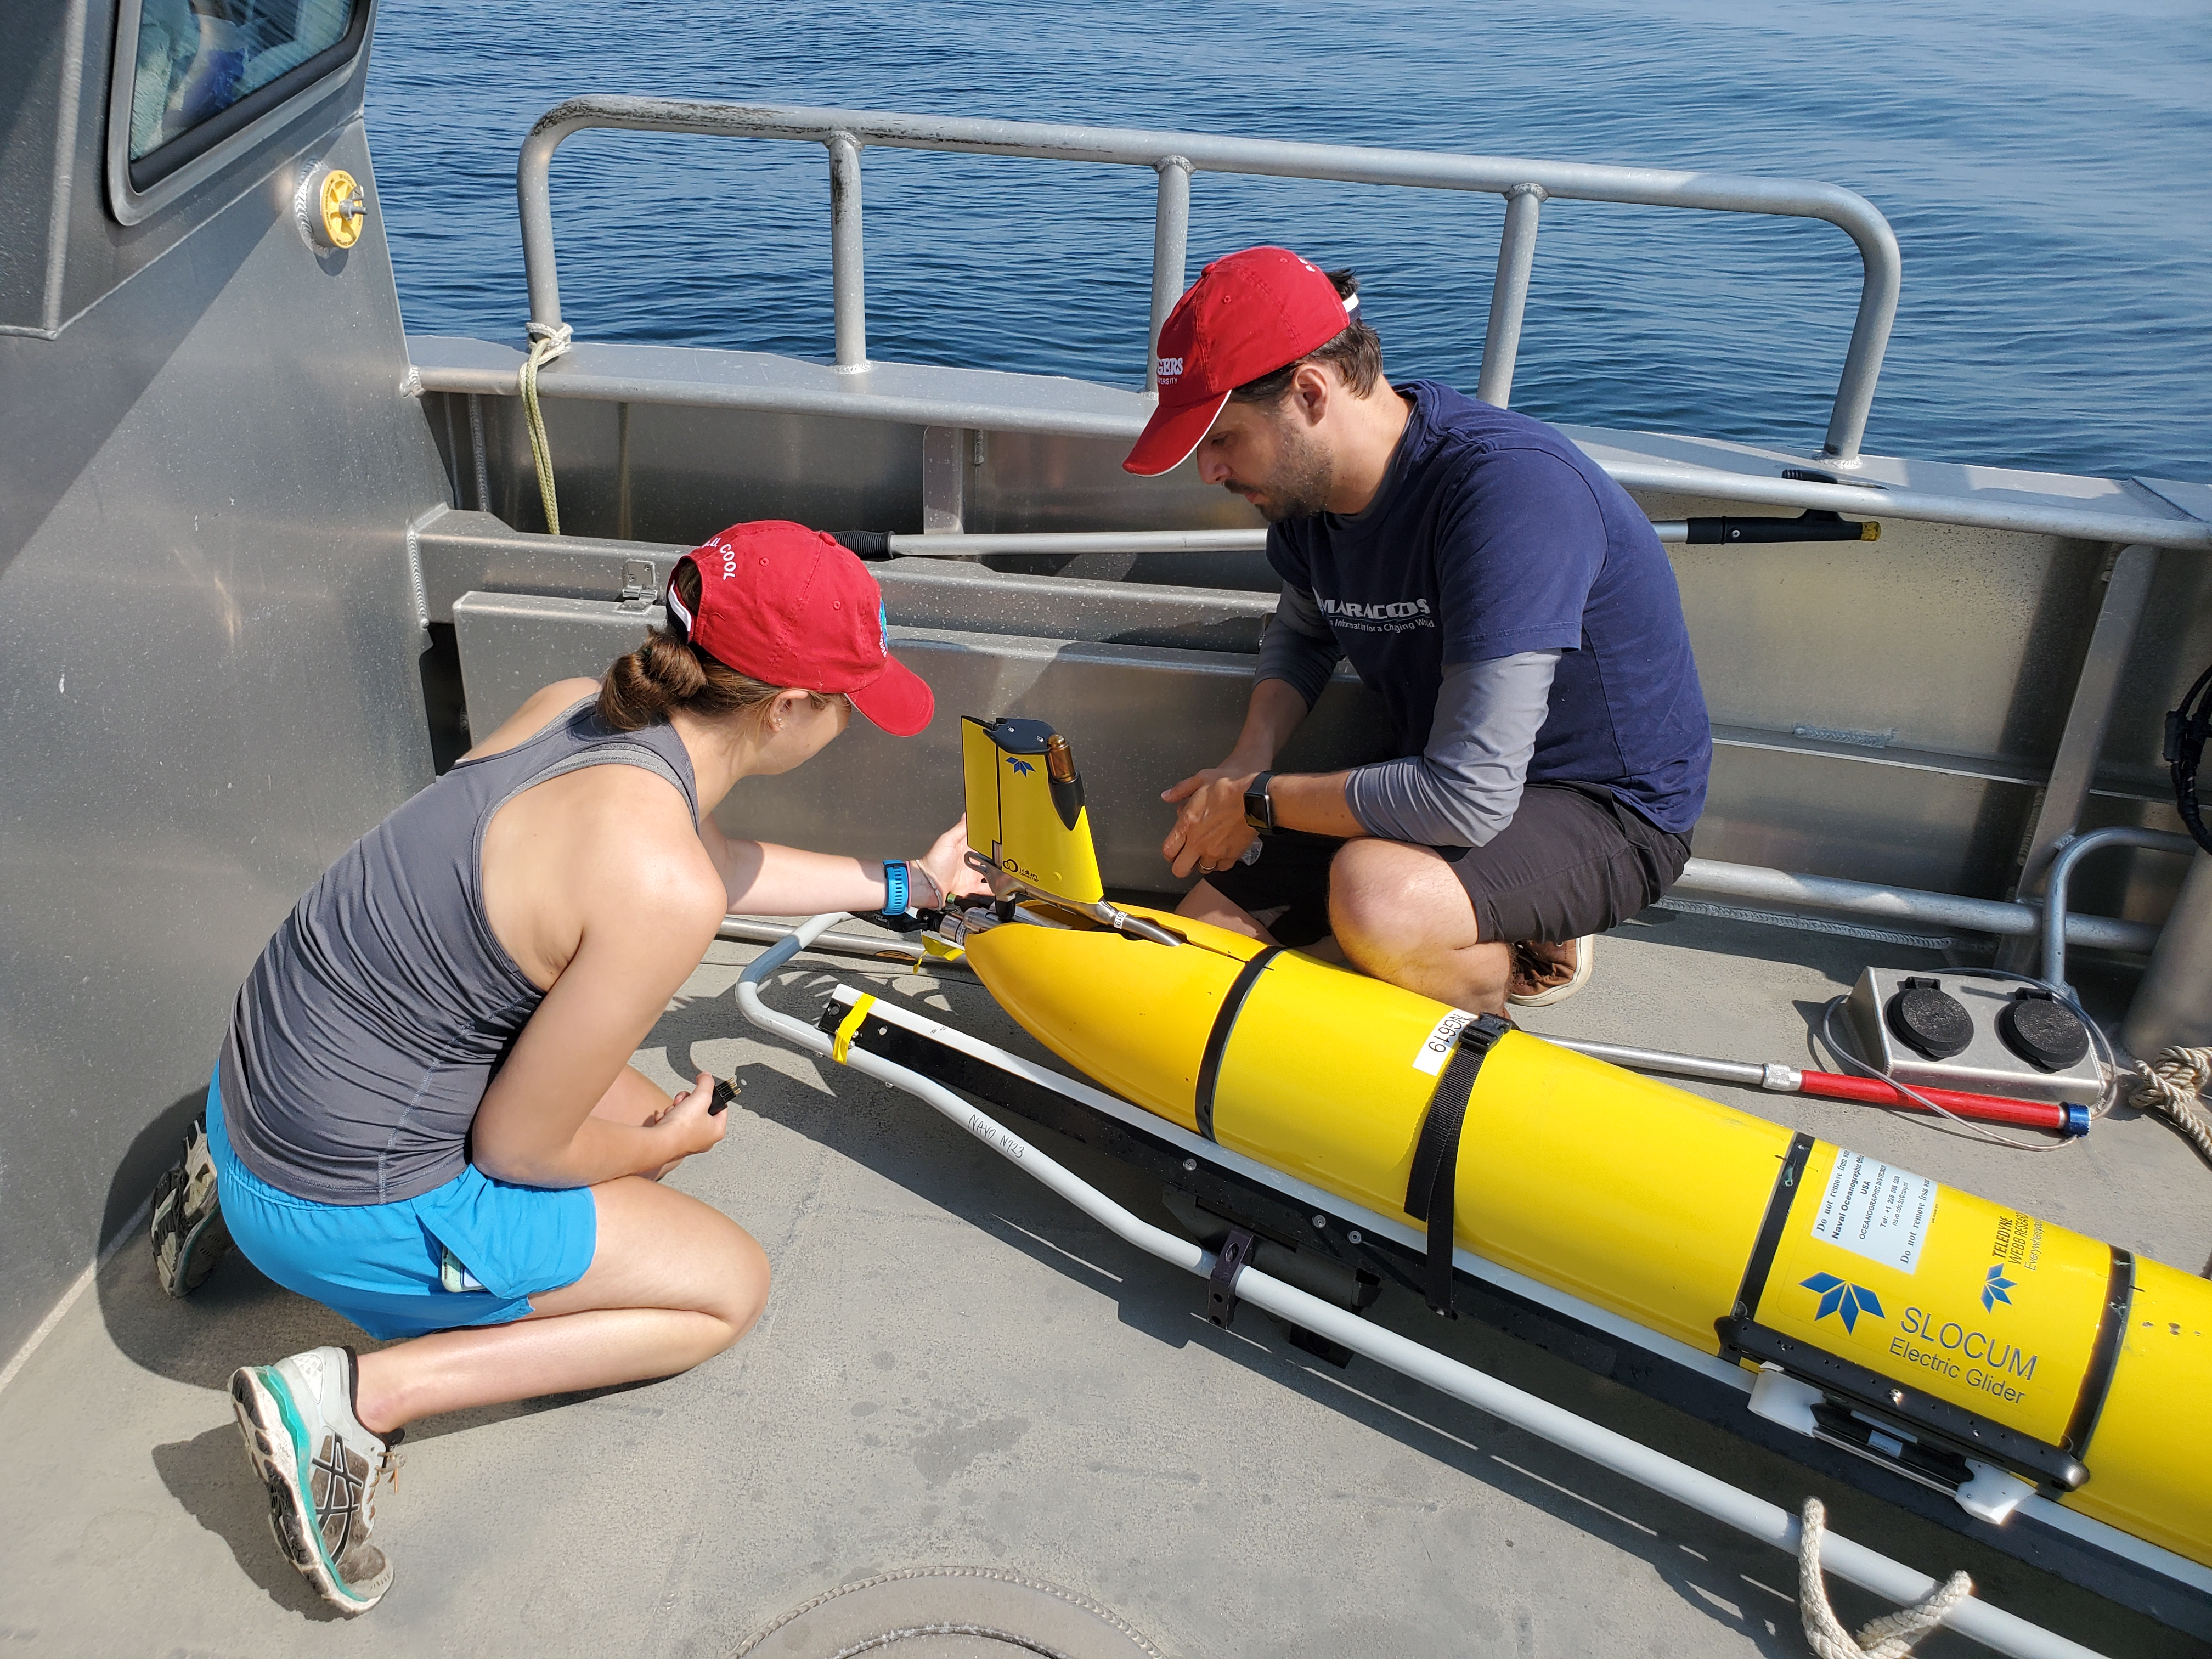
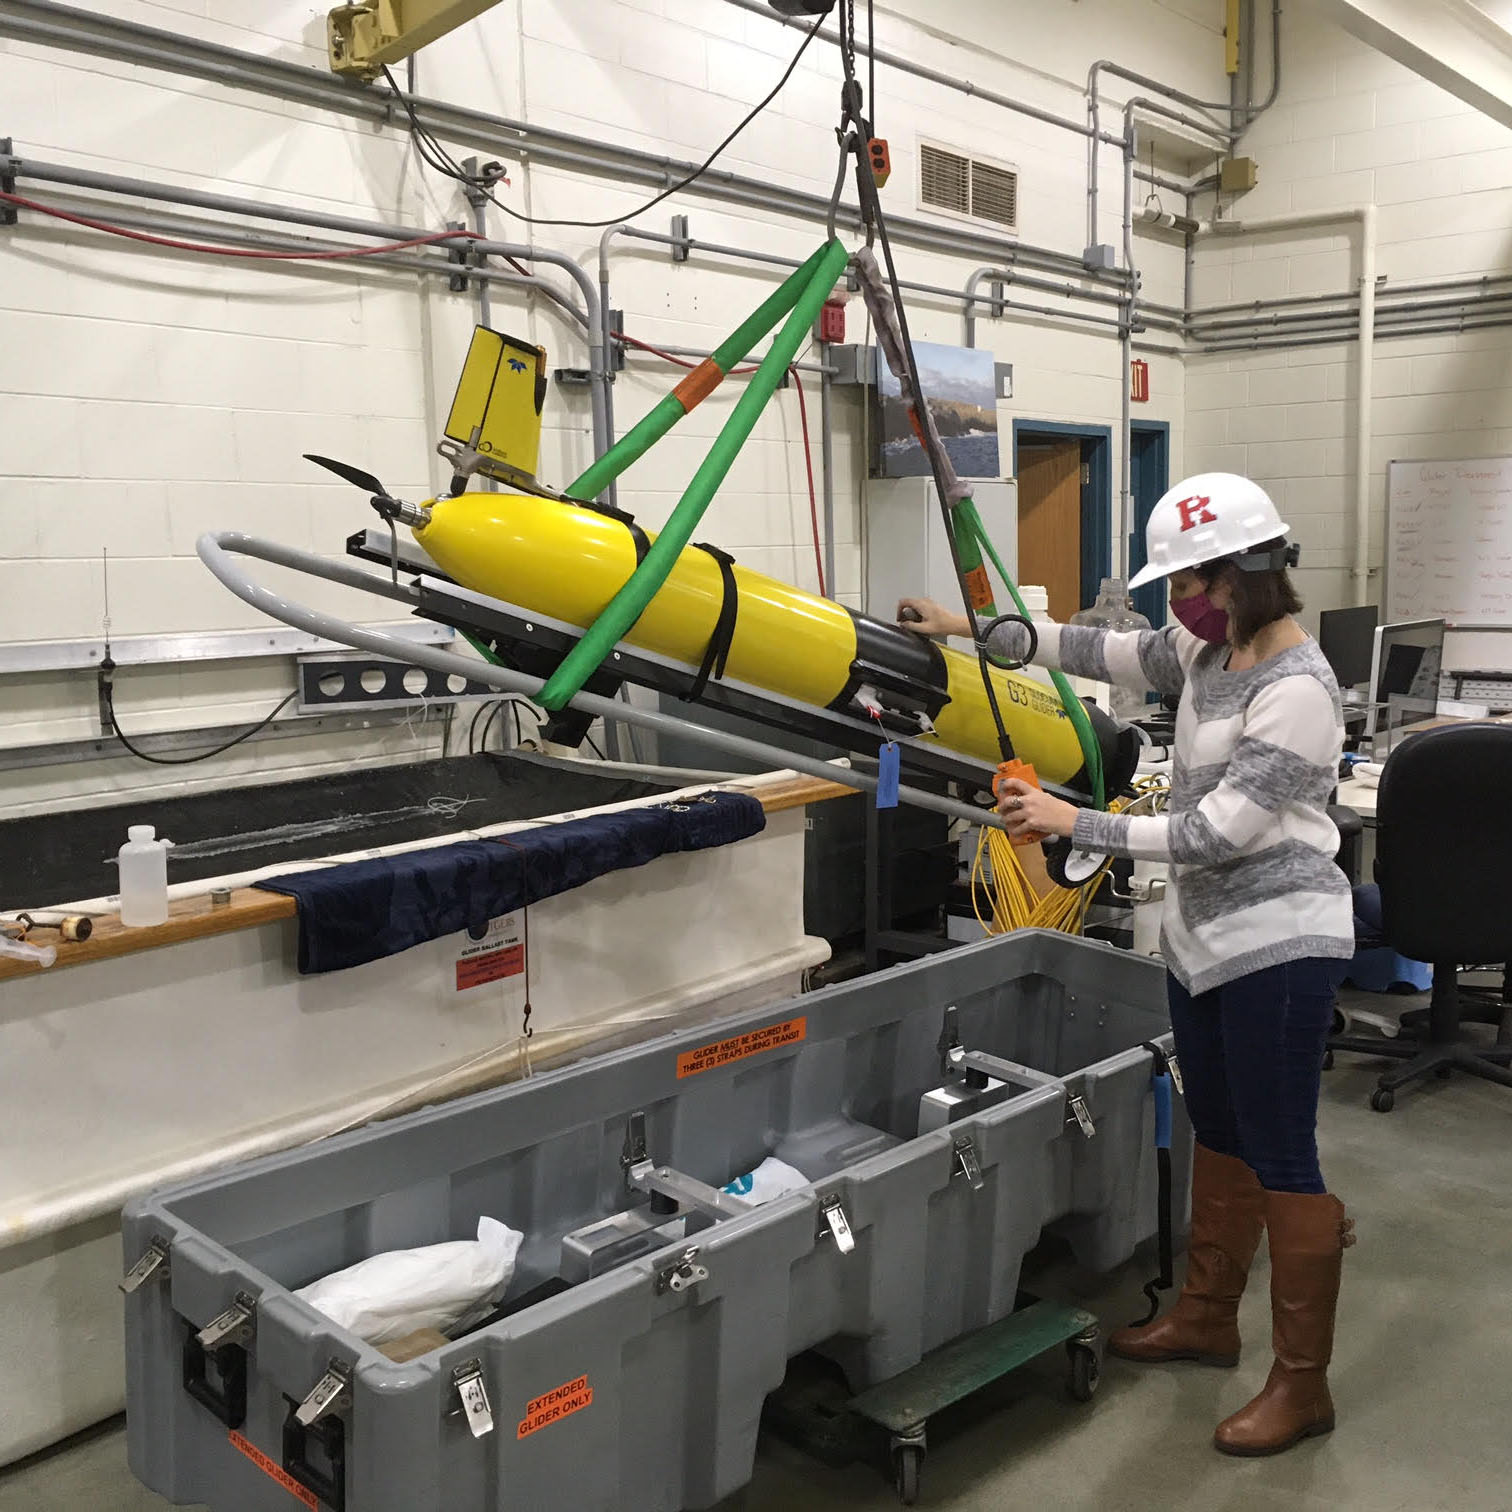
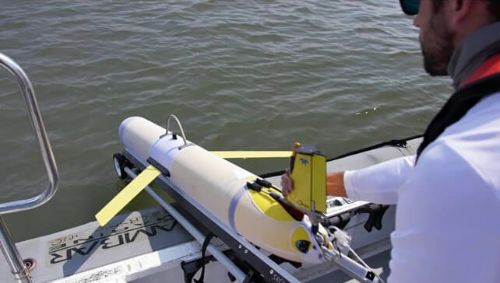
Accurate representation of the upper ocean in models is critical when forecasting hurricane intensity; however, there is a major shortage of subsurface ocean observations available to the models that are used for intensity forecasts. Underwater gliders are uniquely suited to fill this observing gap.
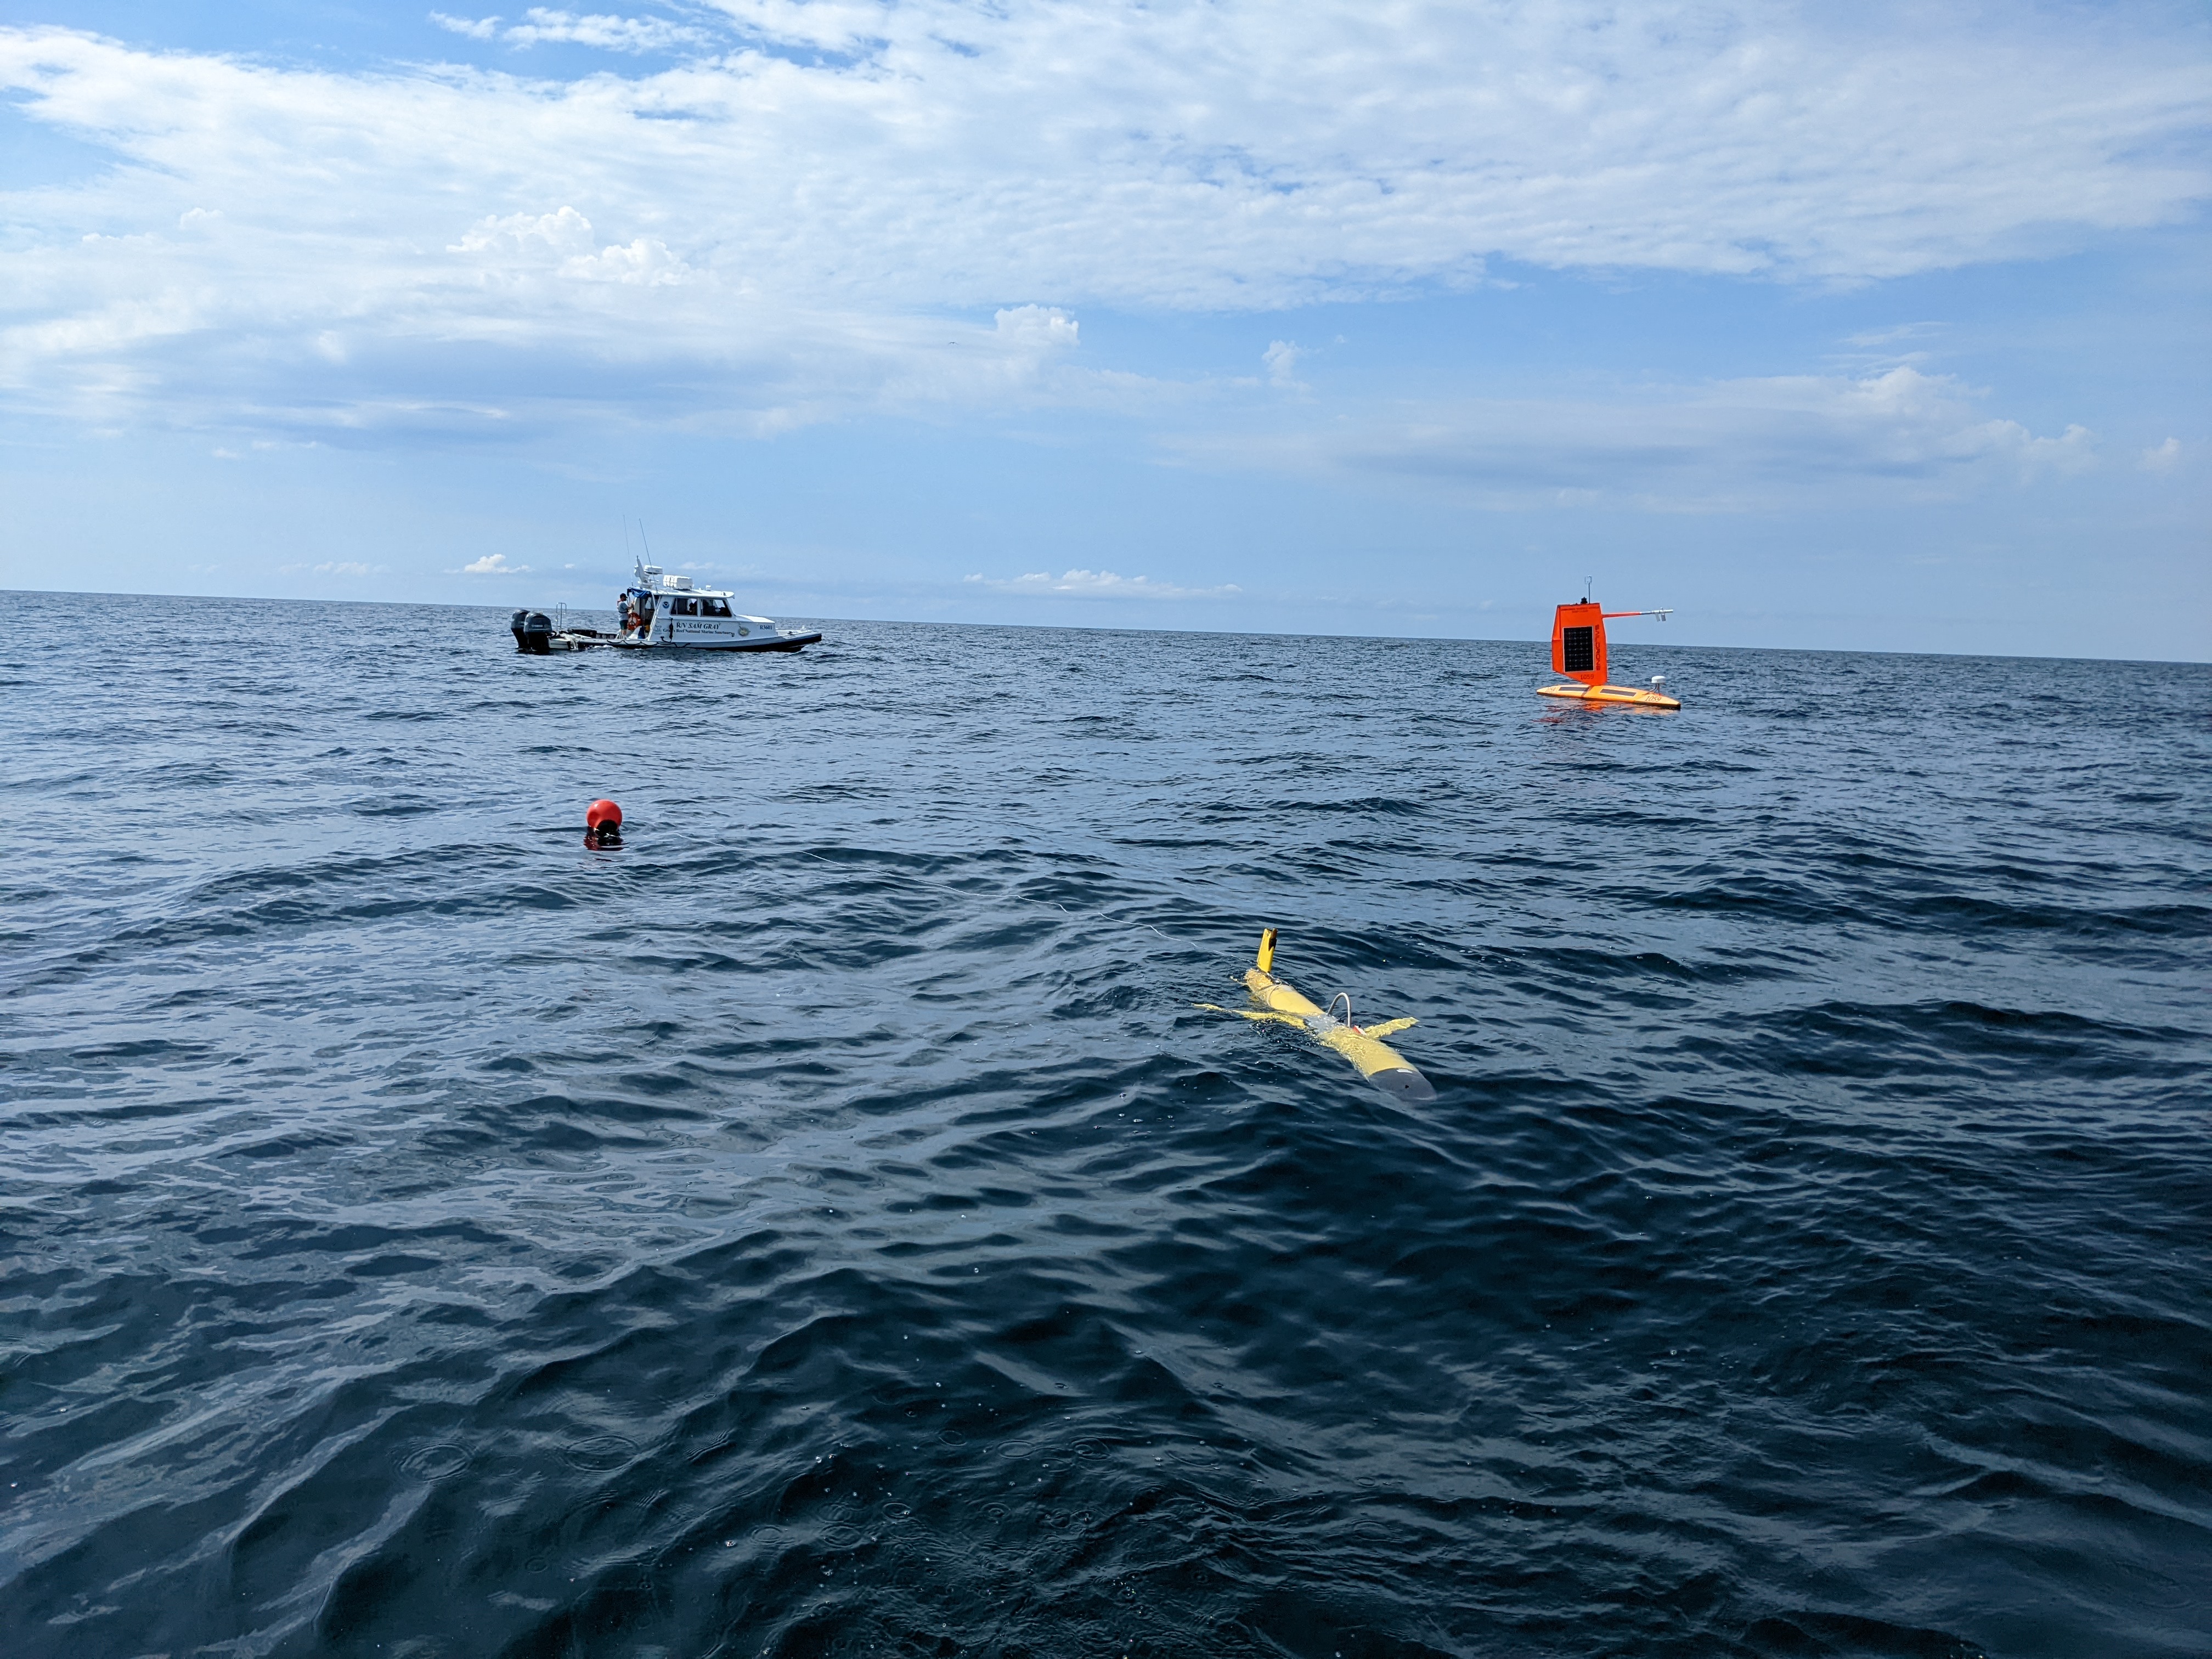
Gliders are one component of a suite of complementary observing platforms gathering critical data that help scientists understand and predict hurricanes. Collectively, these systems capture subsurface, air-sea interface, and atmospheric information to gain a full understanding and picture of the dynamics and processes affecting hurricane intensity and movement. These platforms include Argo floats, eXpendable BathyThermographs (XBTs), moored buoys, surface drifters, satellites, and high frequency radars.
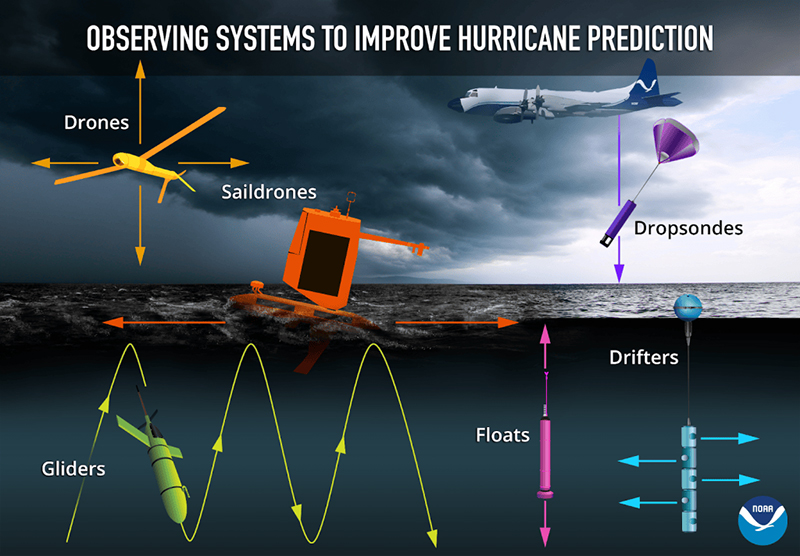
Credit: NOAA/PMEL.
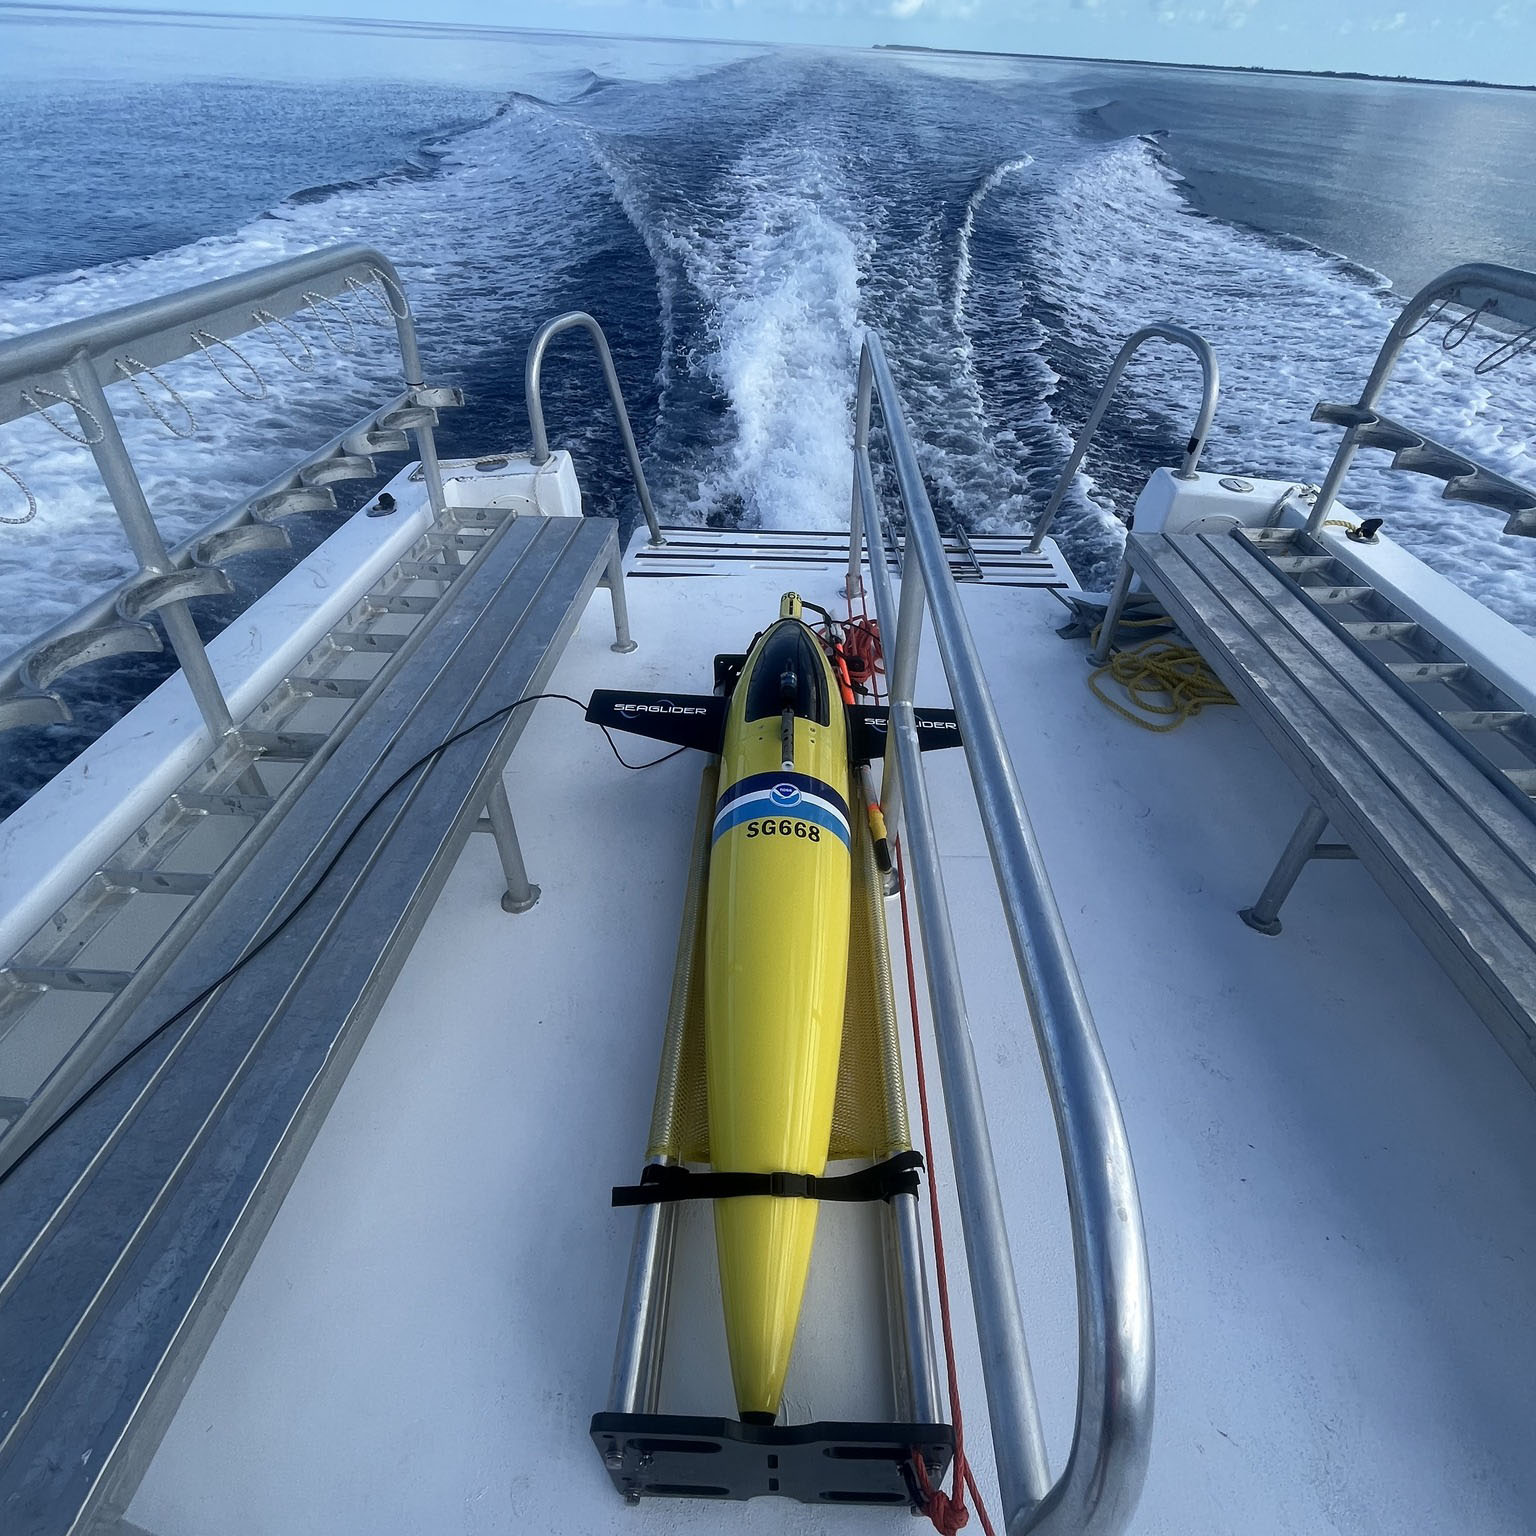
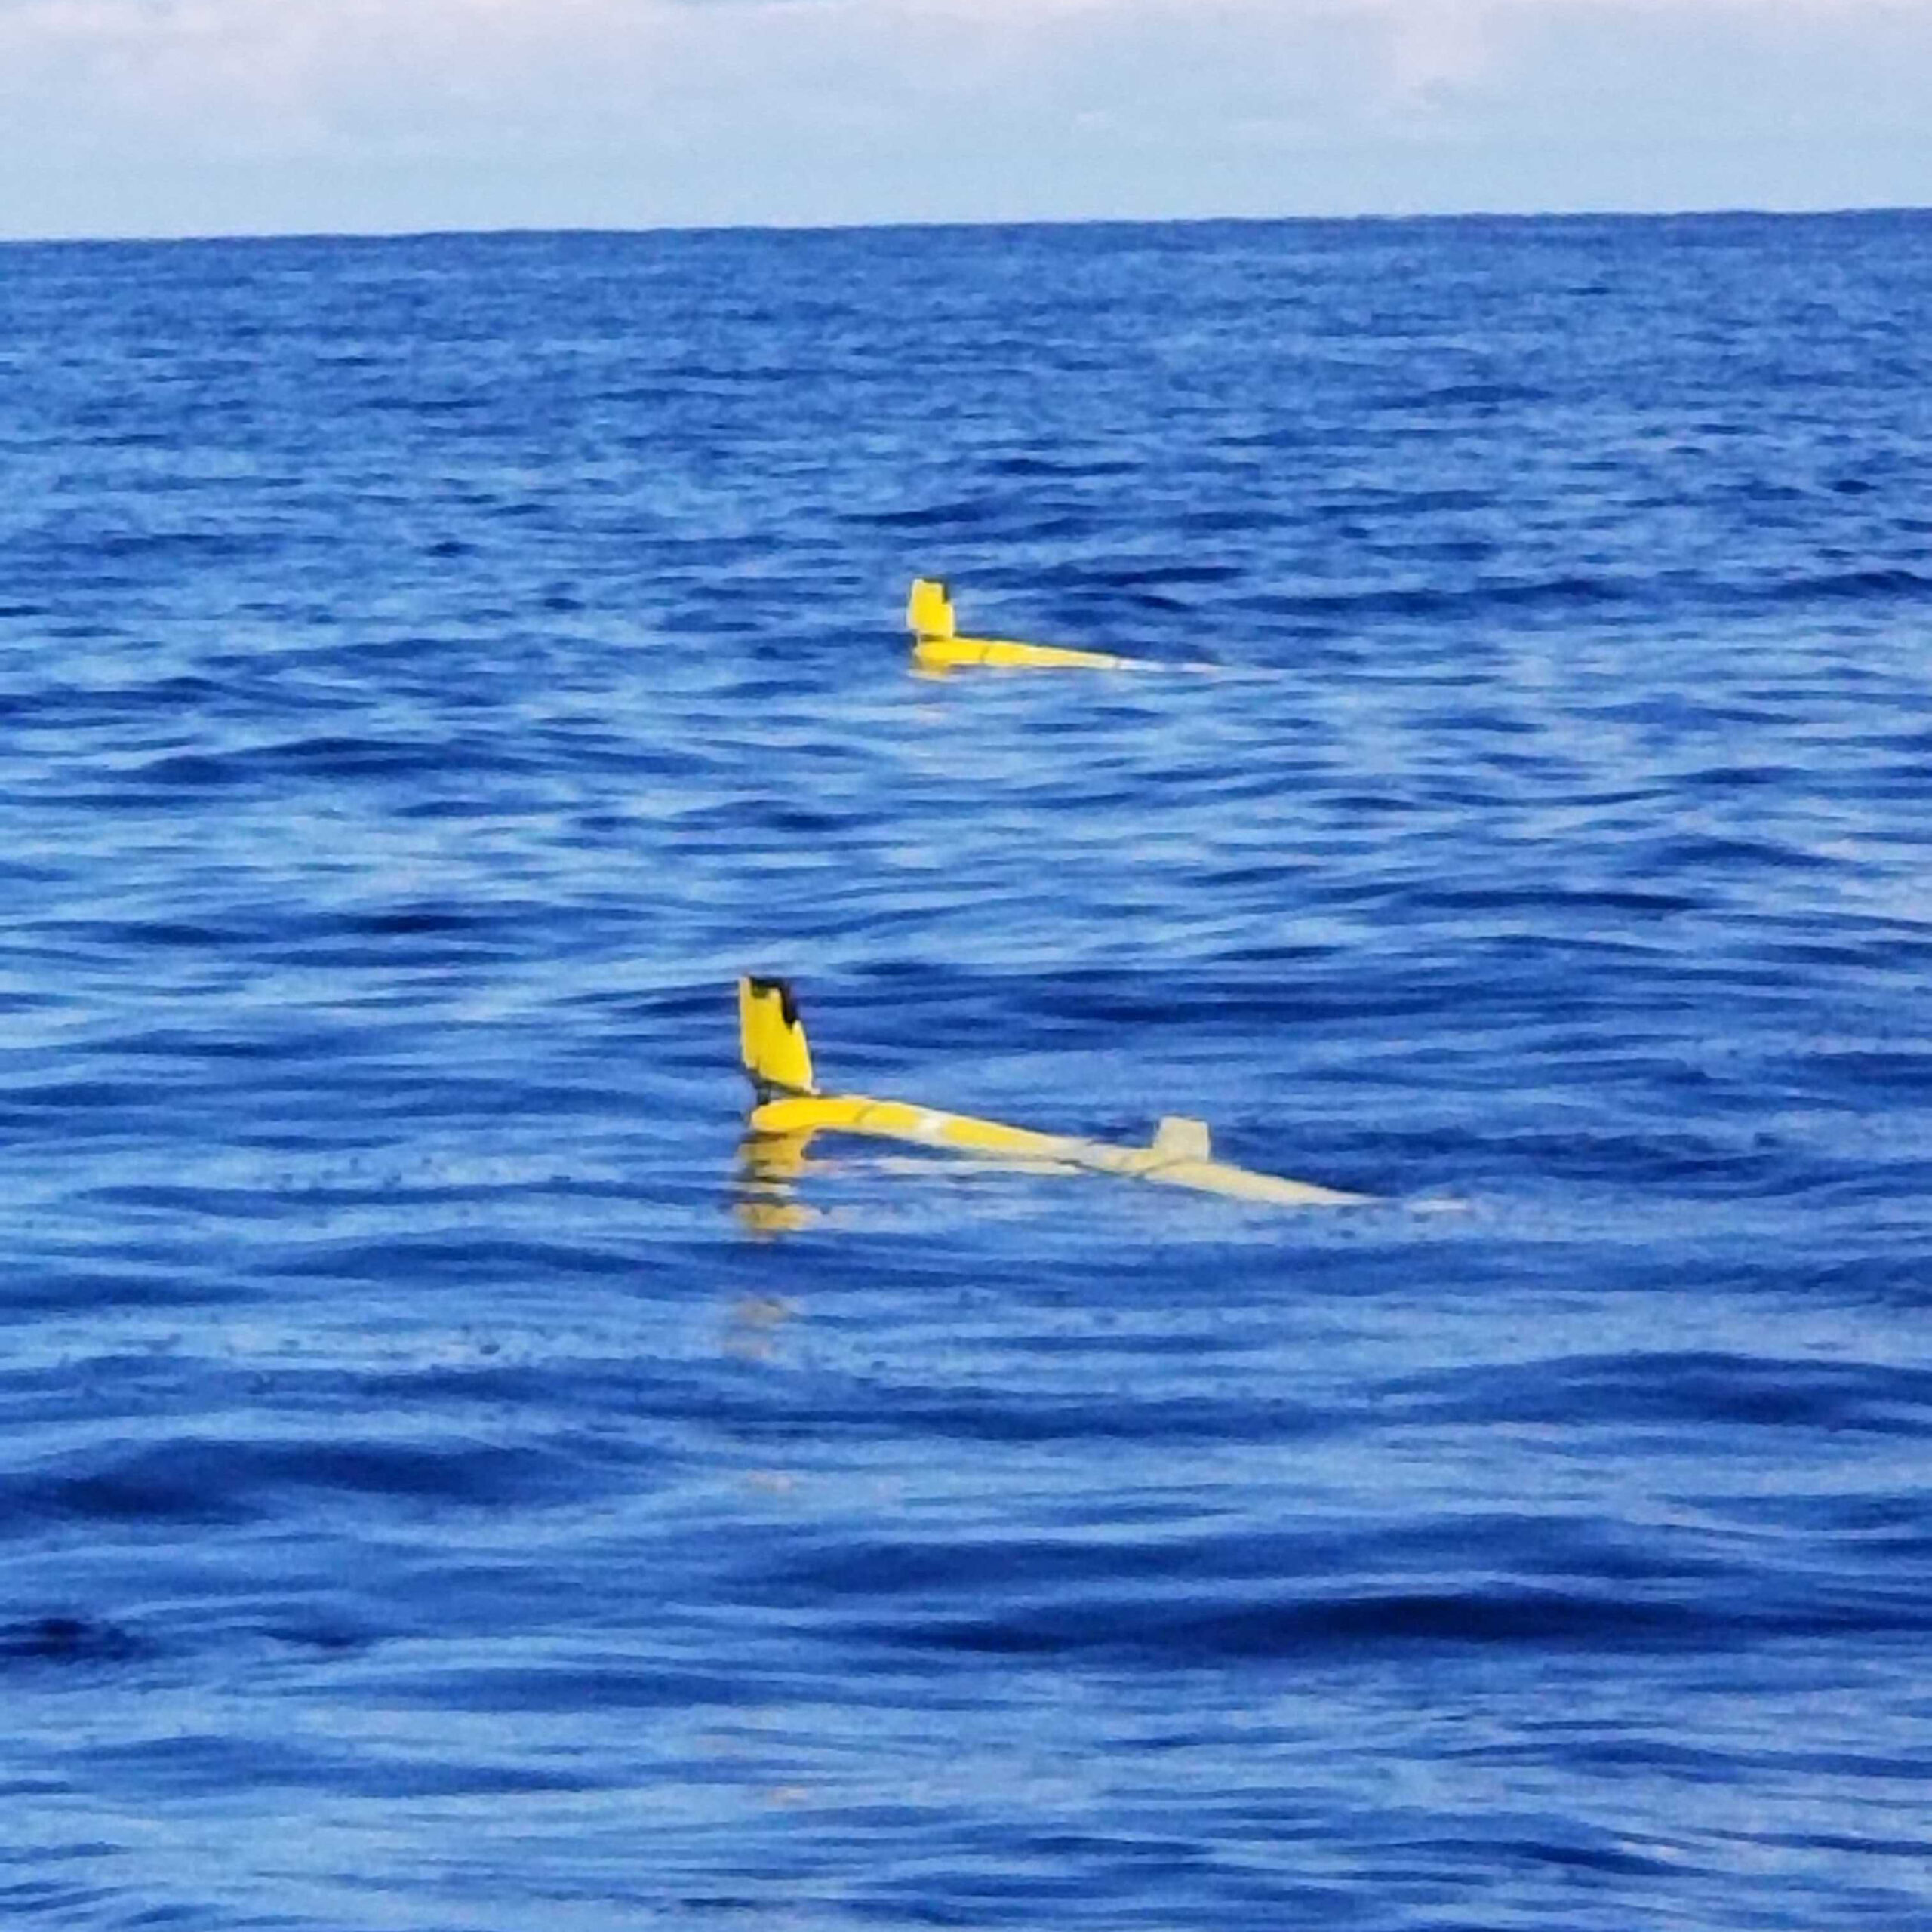
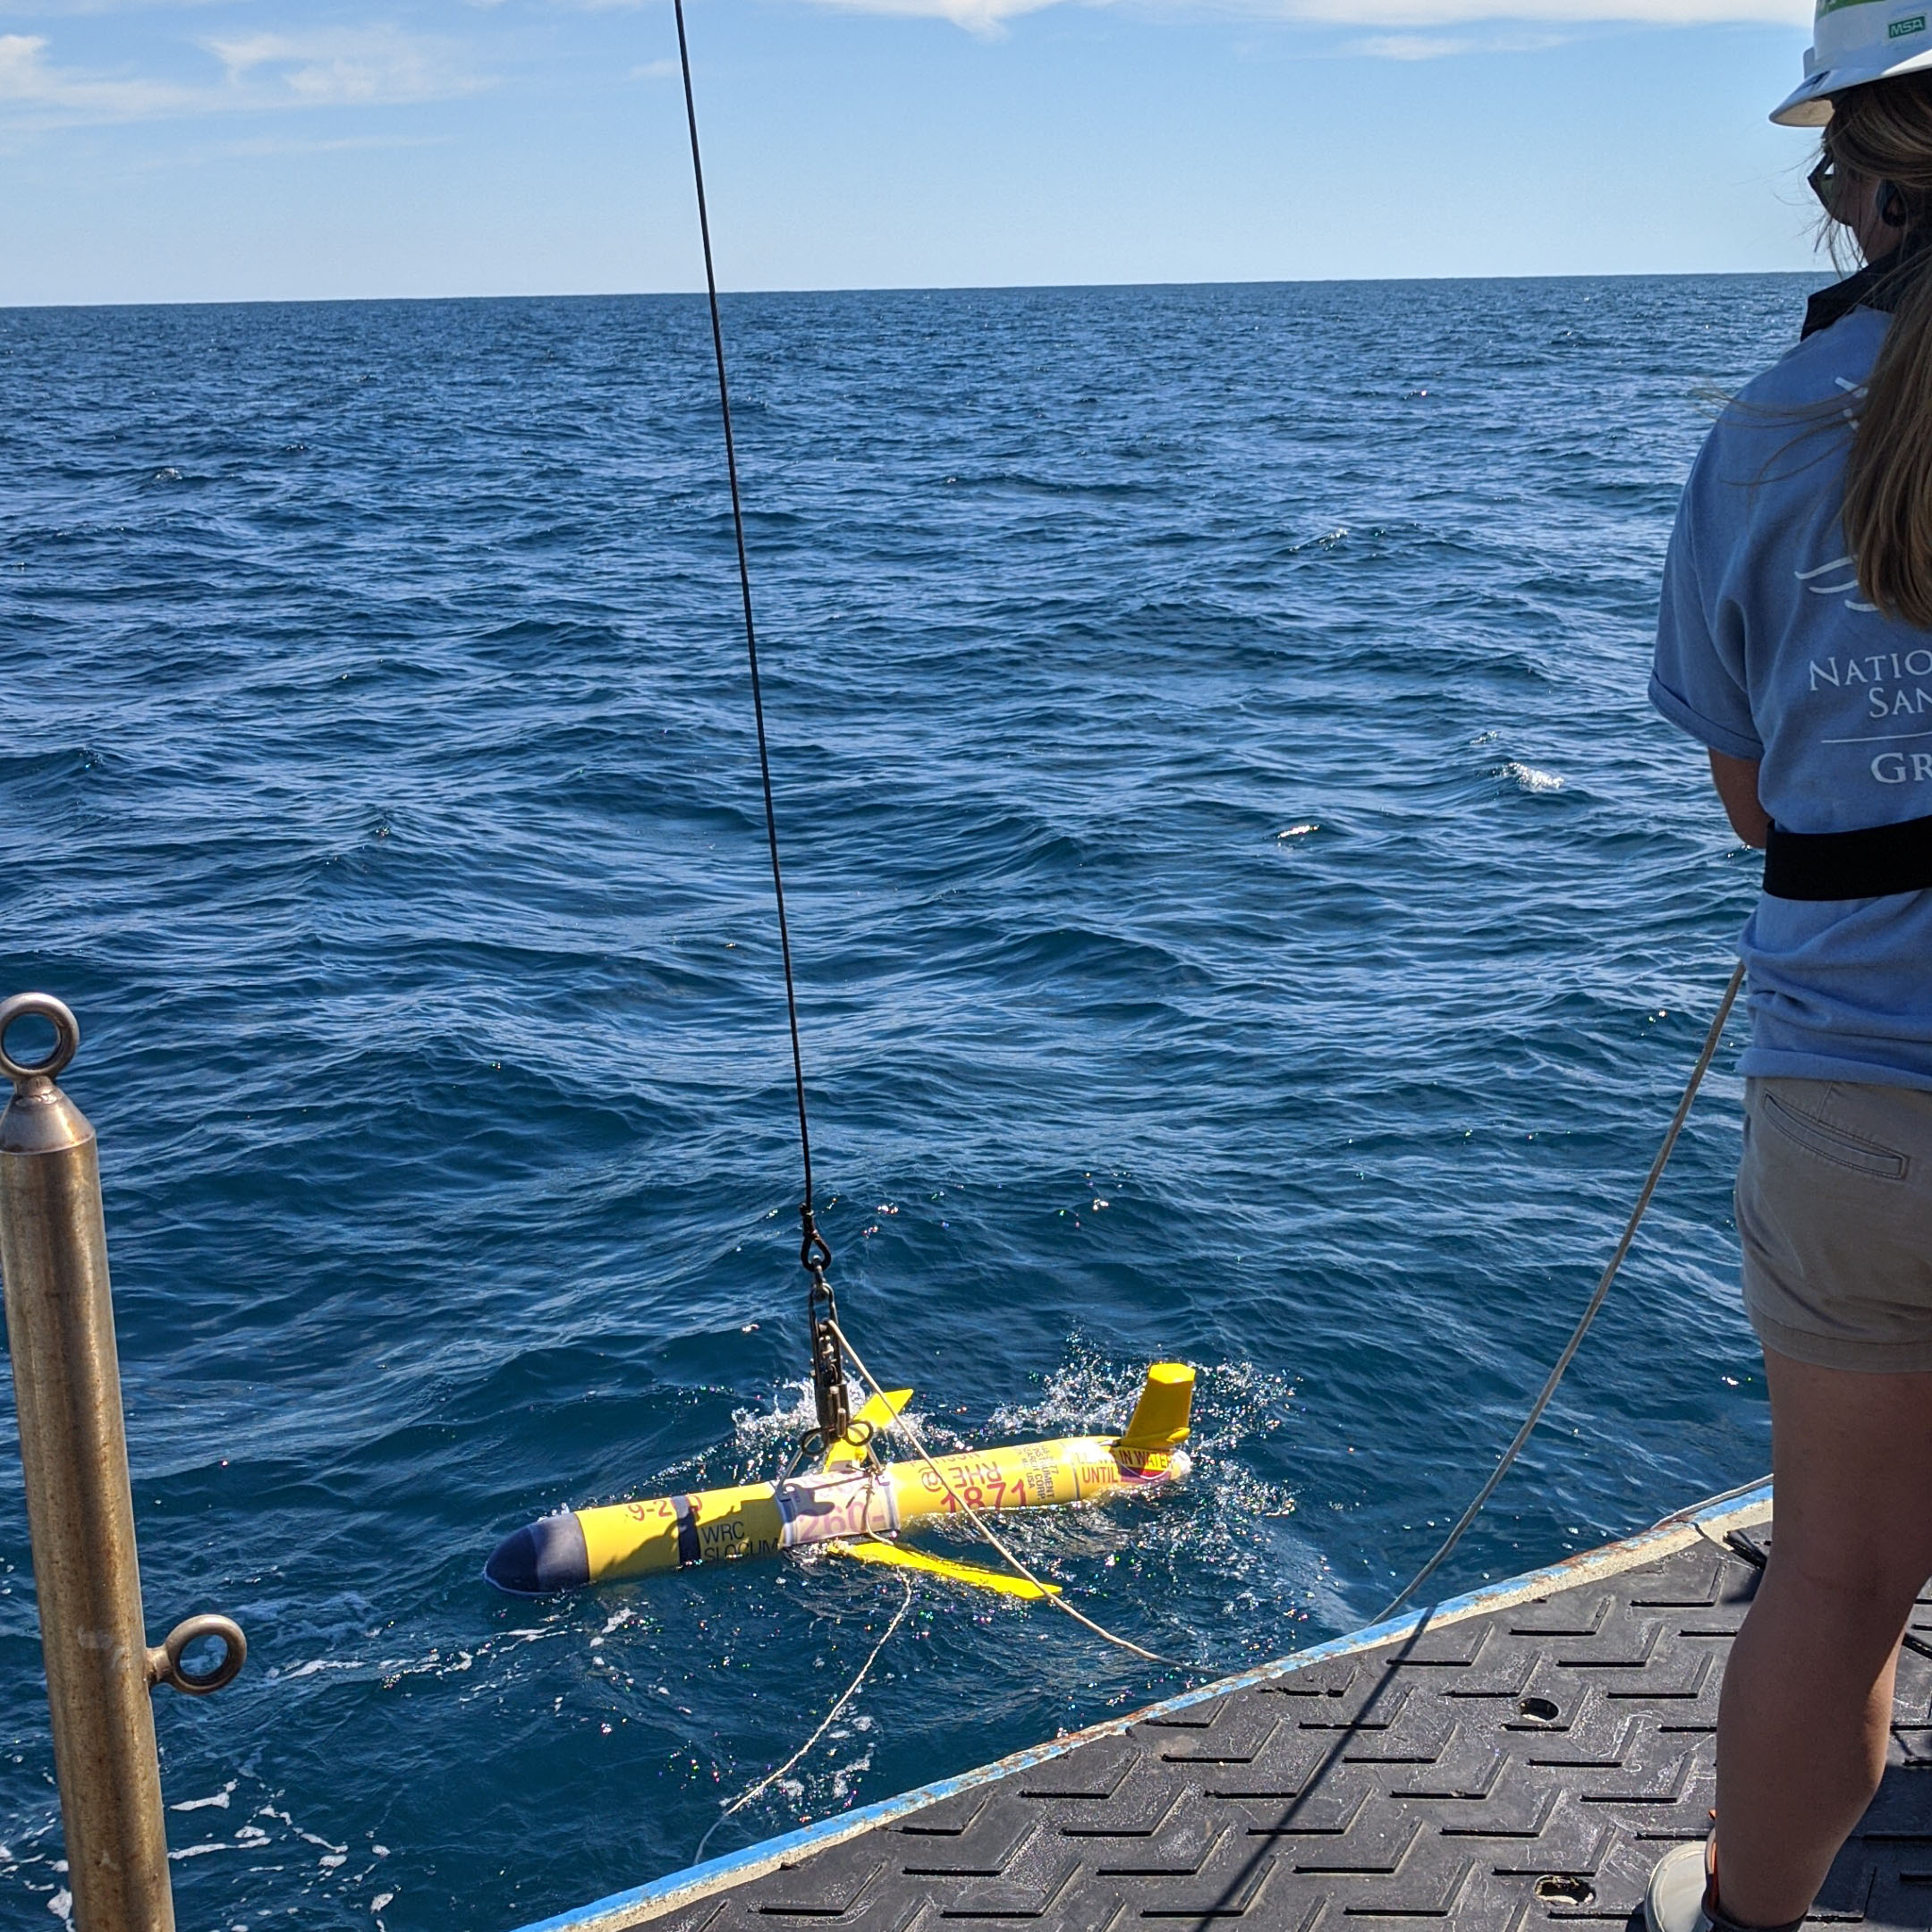
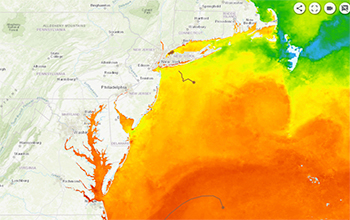
Gliders are used to continuously monitor and track ocean features that are linked to hurricane intensity changes. They can also capture how the ocean changes underneath a passing storm. Due to the gliders’ slow horizontal movement, they are not intended for chasing storms. Rather, they are best used for long-term sampling of these highly dynamic features throughout the entire hurricane season to help keep the global ocean models on track. Examples of these ocean features include:
- Loop Current
- Gulf Stream
- Mid-Atlantic Cold Pool
- Freshwater Barrier Layers
- Atlantic Warm Pool
- Eddies and Rings
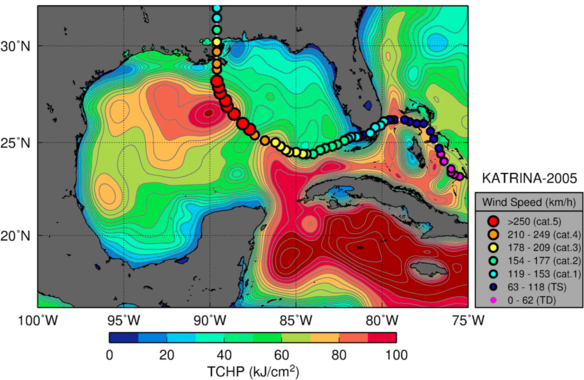
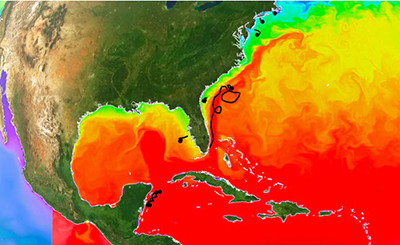
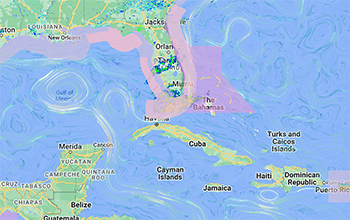
Hurricane Katrina crossed over an area of high Tropical Cyclone Heat Potential, where a Loop Current Eddy contributed to rapid intensification just prior to landfall. Credit: NOAA/AOML.
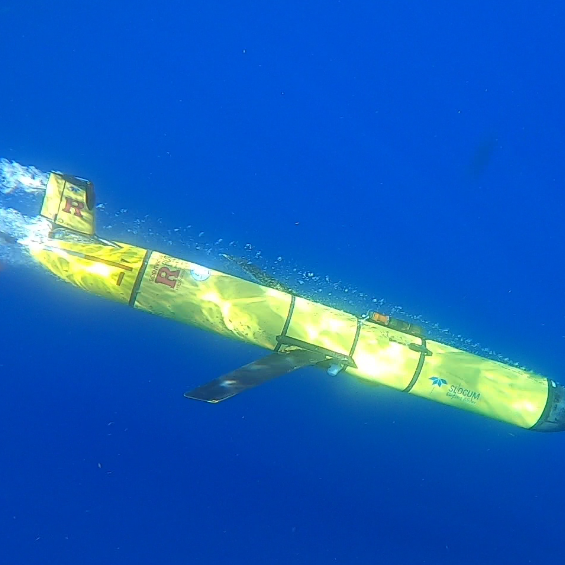
All gliders measure water column temperature, salinity, and pressure, and may also contain additional sensors that measure chlorophyll, dissolved oxygen, currents, etc. These data are transmitted to the IOOS Glider Data Assembly Center (GDAC), from which the temperature and salinity data are delivered to the global ocean circulation models to "course correct" the simulations. The ocean models feed the hurricane models, and studies show that a realistic ocean used in the hurricane models helps produce a more accurate hurricane intensity forecast.
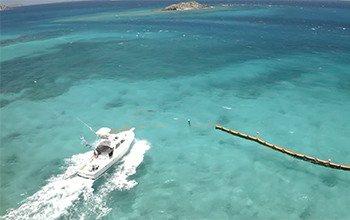
In 2014 the NOAA Atlantic Oceanographic and Meteorological Laboratory (AOML), along with partners including the Caribbean Coastal Ocean Observing System (CARICOOS) and Rutgers University, coordinated on the use of gliders to improve our understanding of the ocean's role in hurricane intensity changes. This collaboration expanded to include additional partners operating gliders in the Caribbean Sea and Tropical Atlantic, Mid-Atlantic Bight, South-Atlantic Bight, and the Gulf of America (formerly Gulf of Mexico). In 2018 the IOOS Office began coordinating this community of multi-institutional, multi-regional glider operators on glider missions during the Atlantic hurricane season.
Glider missions are primarily conducted in U.S. waters by IOOS Regional Associations and their academic members, the U.S. Navy, and NOAA Research partners. The glider operations also contribute to the NOAA Global Ocean and Monitoring Observations (GOMO) Extreme Events Program, which aims to coordinate complementary observing platforms (subsurface, surface and aerial) to improve our understanding of the role of the ocean, waves, and air-sea interactions in the development and intensification of hurricanes in order to produce more accurate and reliable models and forecasts.
By the Numbers

References
- Emanuel, K. Increasing destructiveness of tropical cyclones over the past 30 years. Nature 436, 686–688 (2005).
- NOAA National Centers for Environmental Information (NCEI) U.S. Billion-Dollar Weather and Climate Disasters (2023). https://www.ncei.noaa.gov/access/billions/, DOI: 10.25921/stkw-7w73
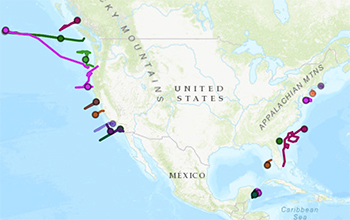
Planned 2026 Hurricane Glider Missions
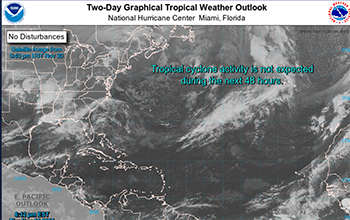
NOAA predicts a below-average Atlantic hurricane season and an above-average hurricane season for the Eastern Pacific and Central Pacific basins. The hurricane glider coordination group, composed of numerous organizations across NOAA, U.S. Navy, and academia, expects to deploy approximately 26 Atlantic and 6 Pacific hurricane mission-specific gliders, in hurricane-prone coastal regions of the U.S. Approximately 50 gliders deployed for other, non-hurricane missions will also be leveraged. The data from these gliders will be used in NOAA’s models to help improve the accuracy of hurricane intensity forecasts for the 2026 hurricane season


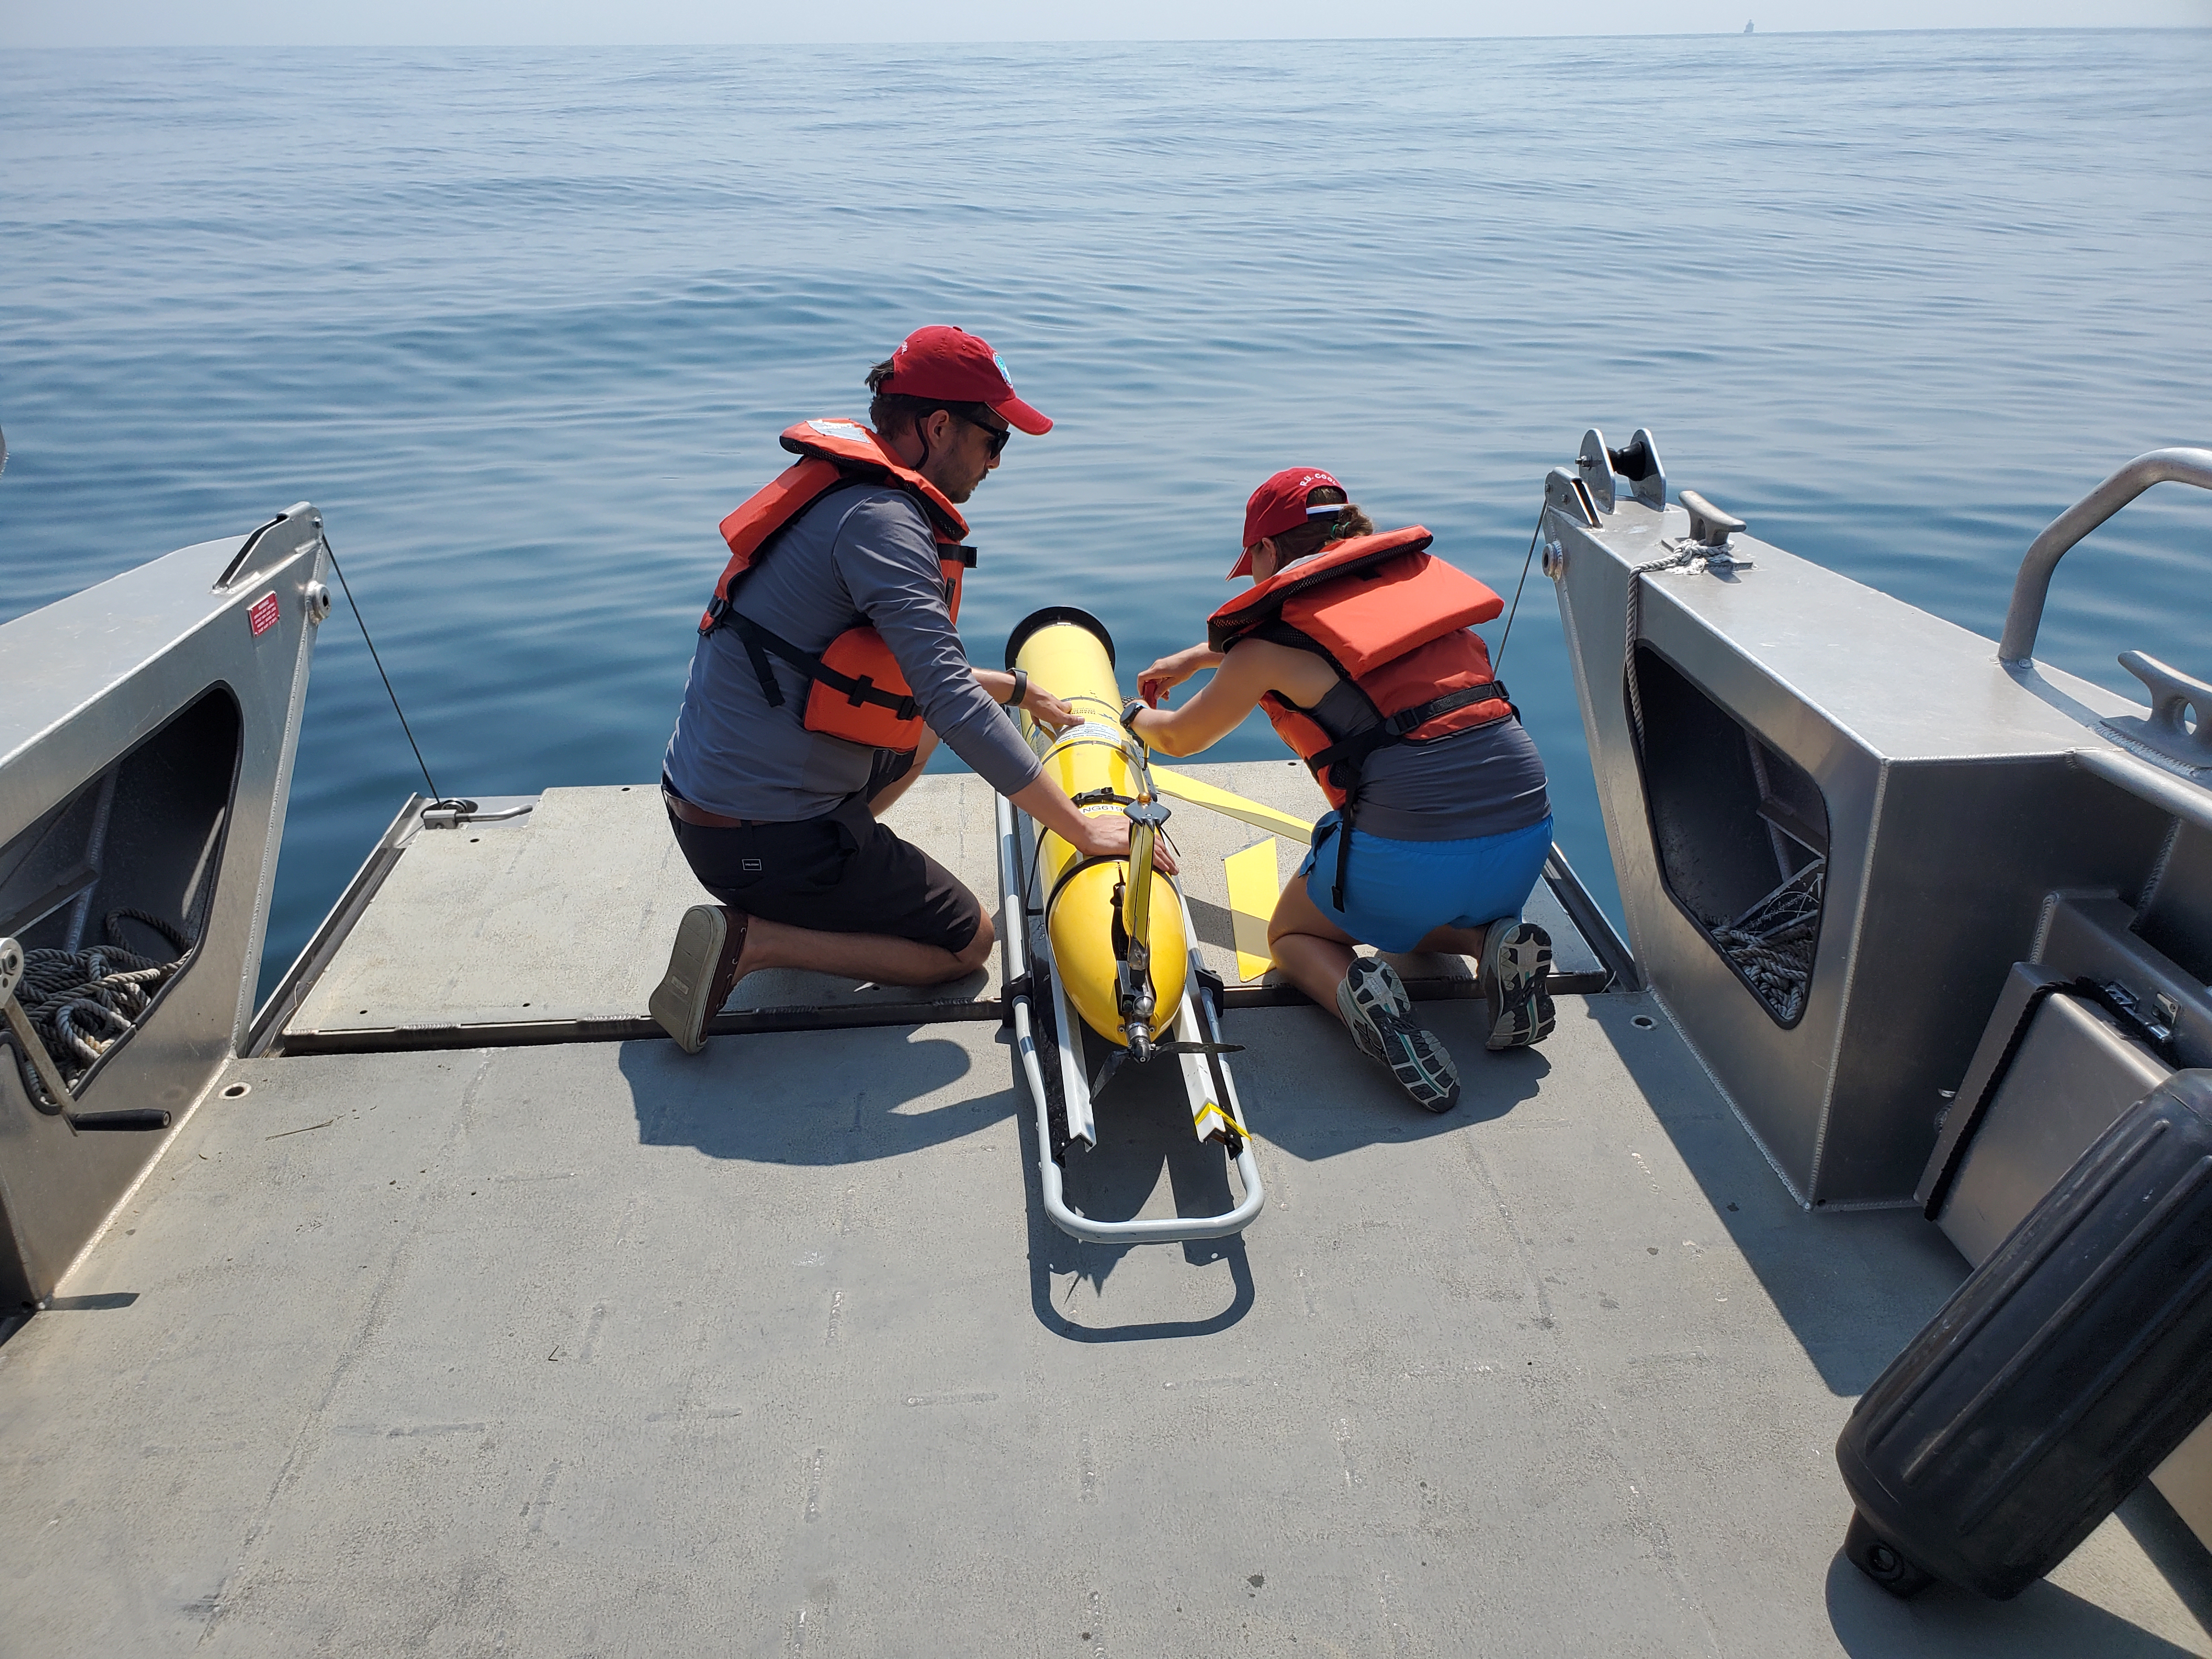
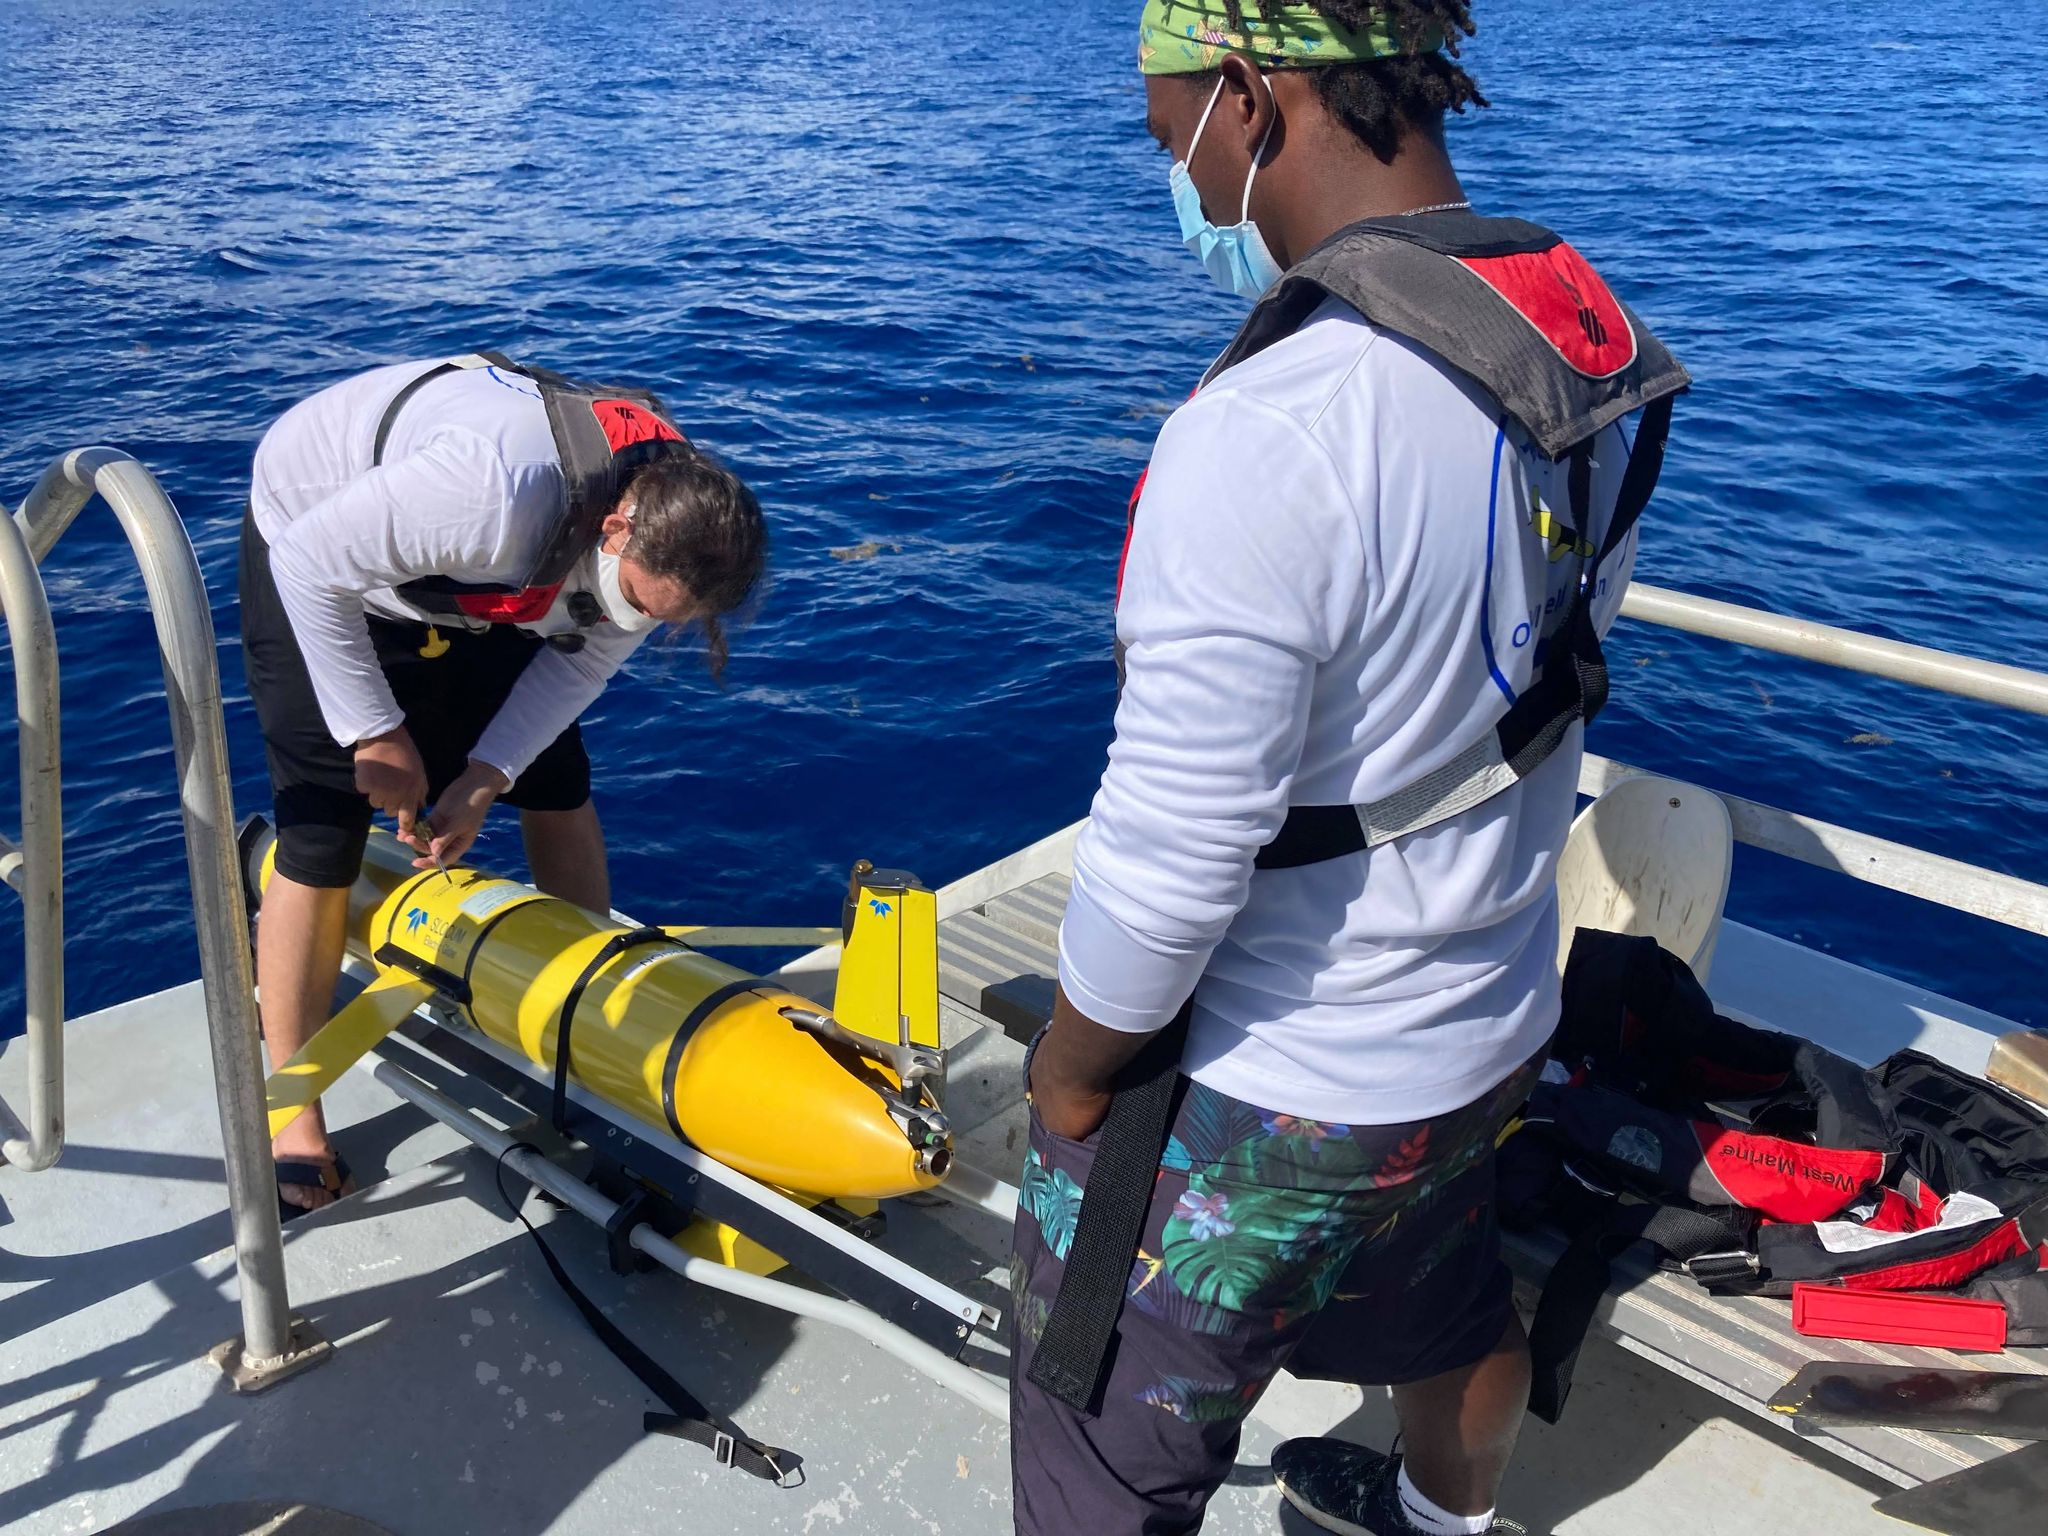
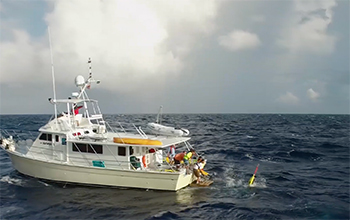
![]() Since 2018, the U.S. Navy Commander, Naval Meteorology and Oceanography Command (CNMOC), and its operational command, the Naval Oceanographic Office (NAVOCEANO), has contributed Navy Littoral Battlespace Sensing gliders (LBS-G) to NOAA for ocean heat content missions. These Navy gliders have helped fill important upper ocean observing gaps in the NOAA ocean model that feeds the hurricane intensity forecasts. In fact, the Navy glider observations comprise approximately 25% of all the cumulative Atlantic glider observations delivered to NOAA each season. This partnership has involved over a dozen institutions and NOAA programs, working together on glider operations and data delivery. Since 2021, support for the glider operations has been made possible by the NOAA OMAO Uncrewed Systems Operations Center.
Since 2018, the U.S. Navy Commander, Naval Meteorology and Oceanography Command (CNMOC), and its operational command, the Naval Oceanographic Office (NAVOCEANO), has contributed Navy Littoral Battlespace Sensing gliders (LBS-G) to NOAA for ocean heat content missions. These Navy gliders have helped fill important upper ocean observing gaps in the NOAA ocean model that feeds the hurricane intensity forecasts. In fact, the Navy glider observations comprise approximately 25% of all the cumulative Atlantic glider observations delivered to NOAA each season. This partnership has involved over a dozen institutions and NOAA programs, working together on glider operations and data delivery. Since 2021, support for the glider operations has been made possible by the NOAA OMAO Uncrewed Systems Operations Center.
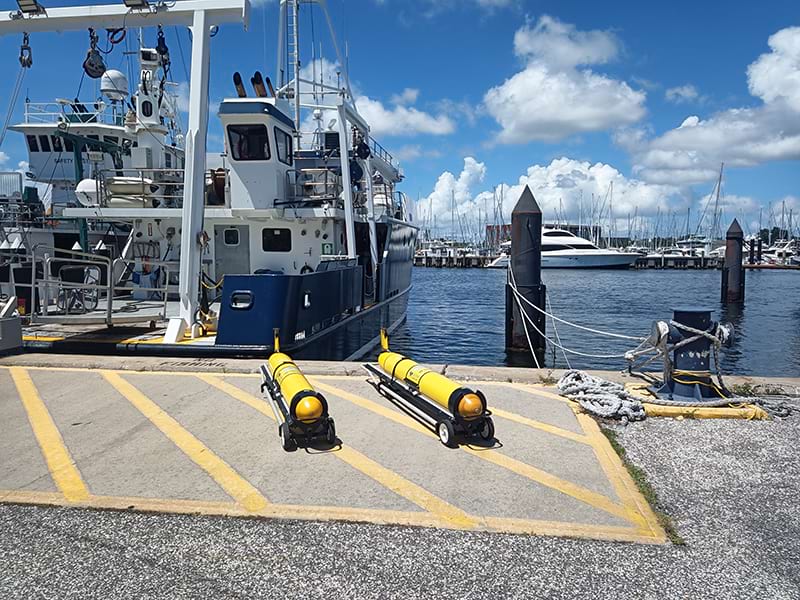
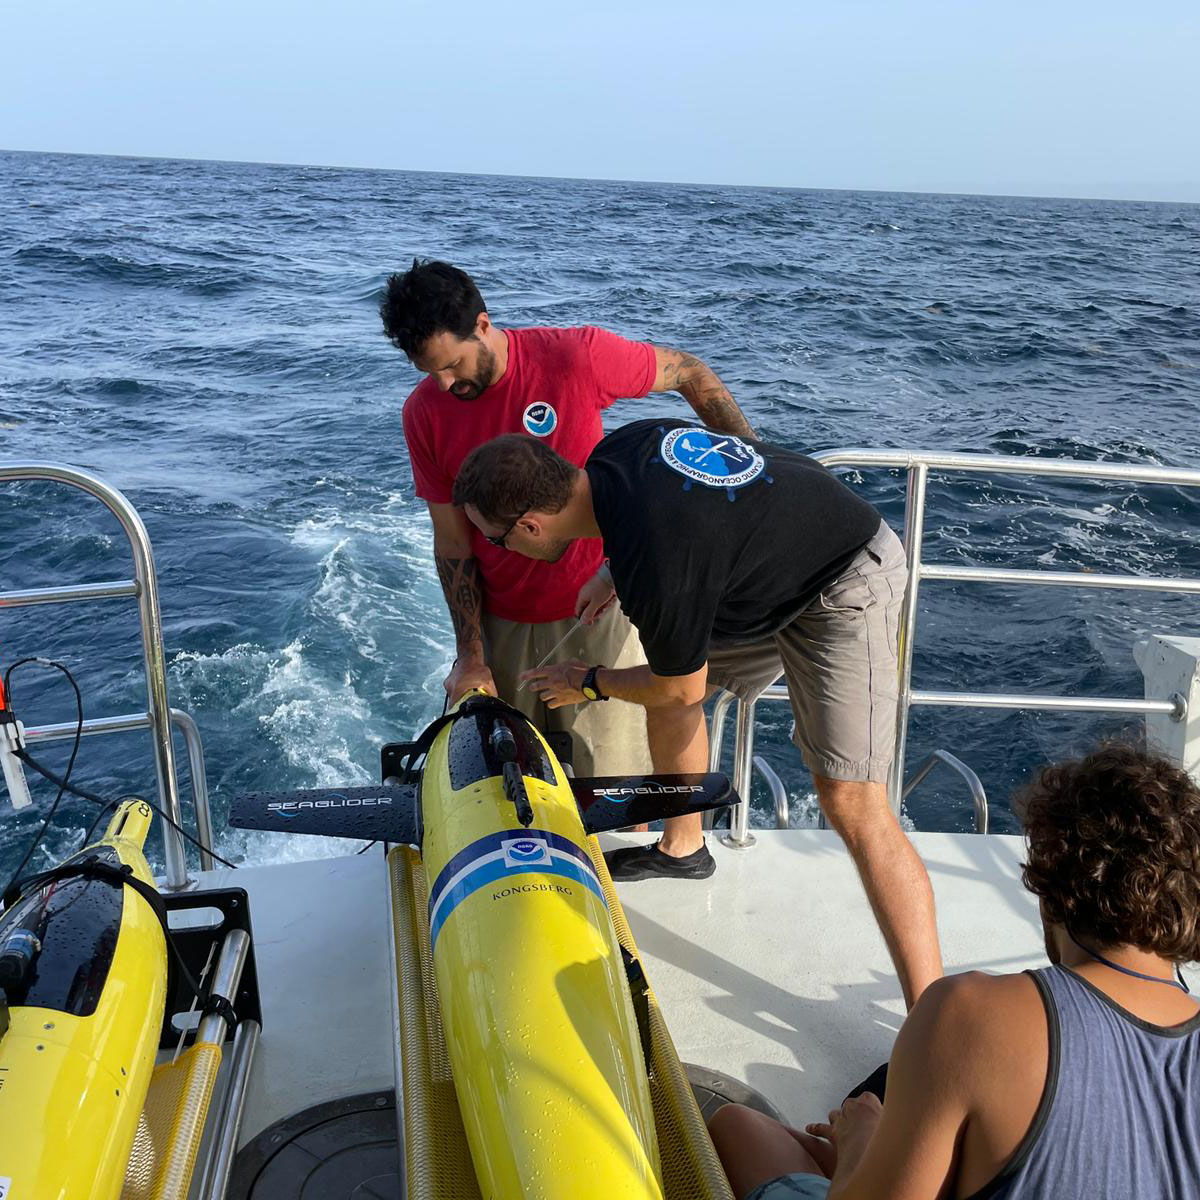
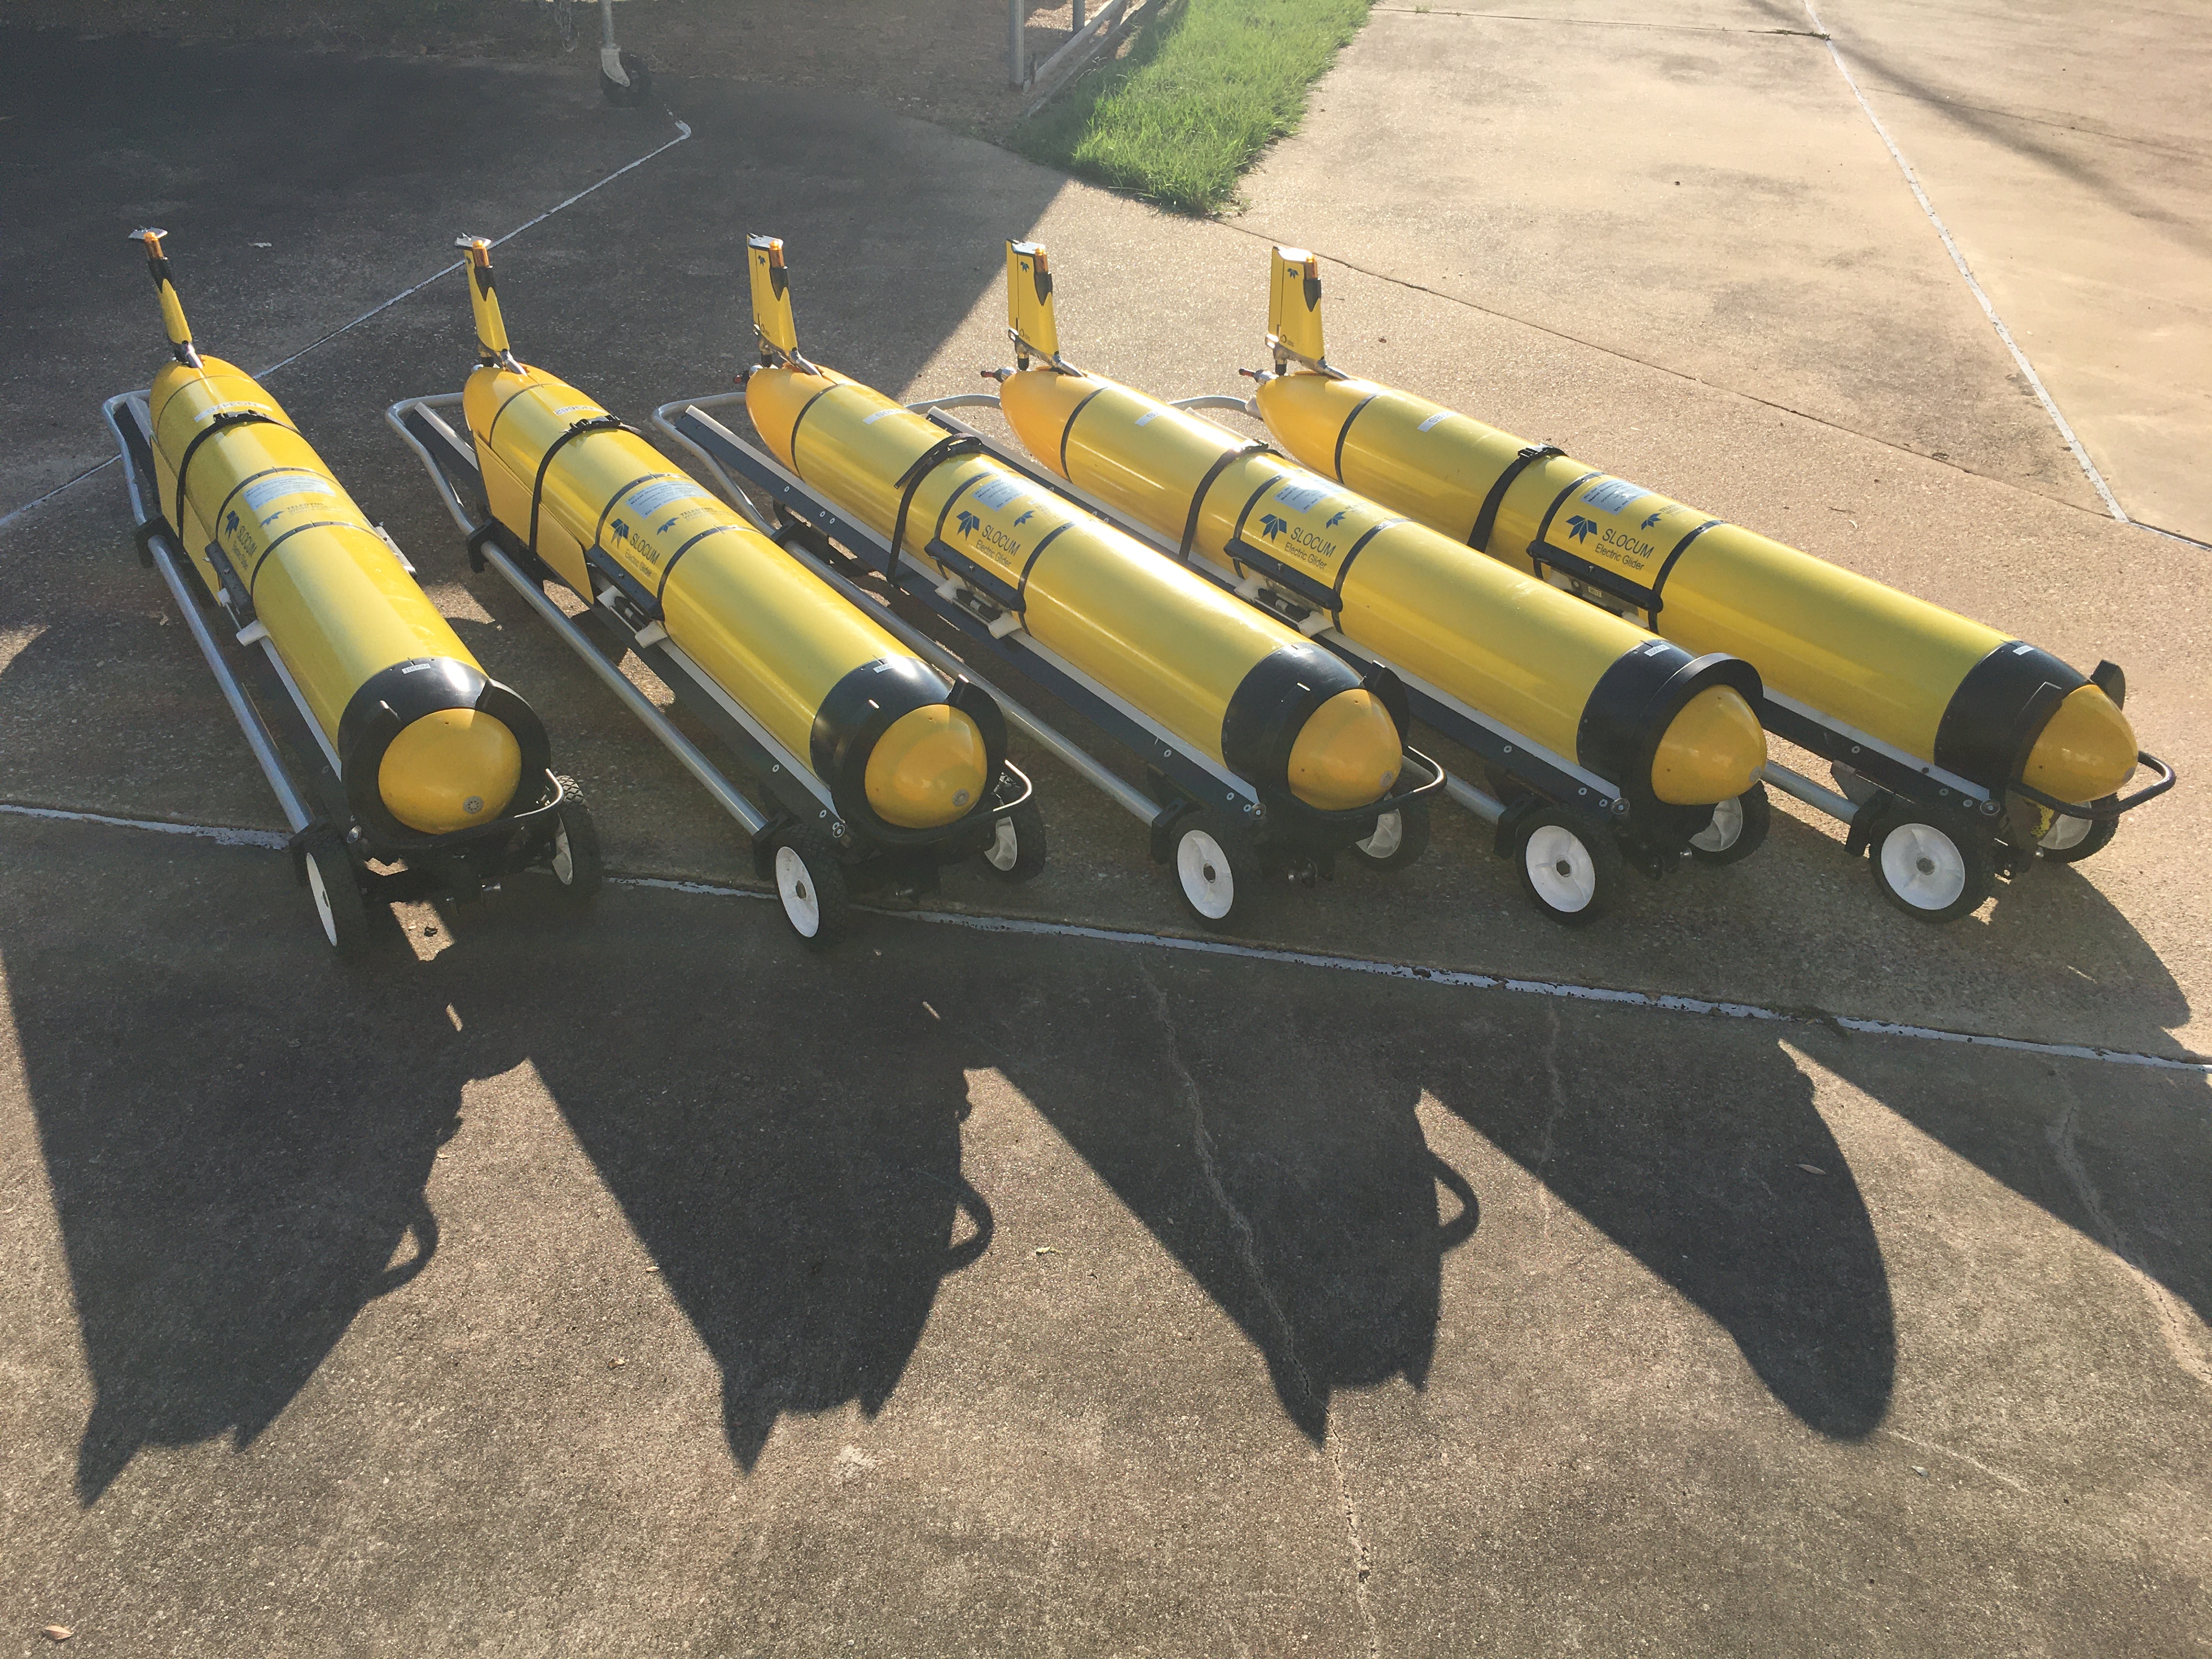
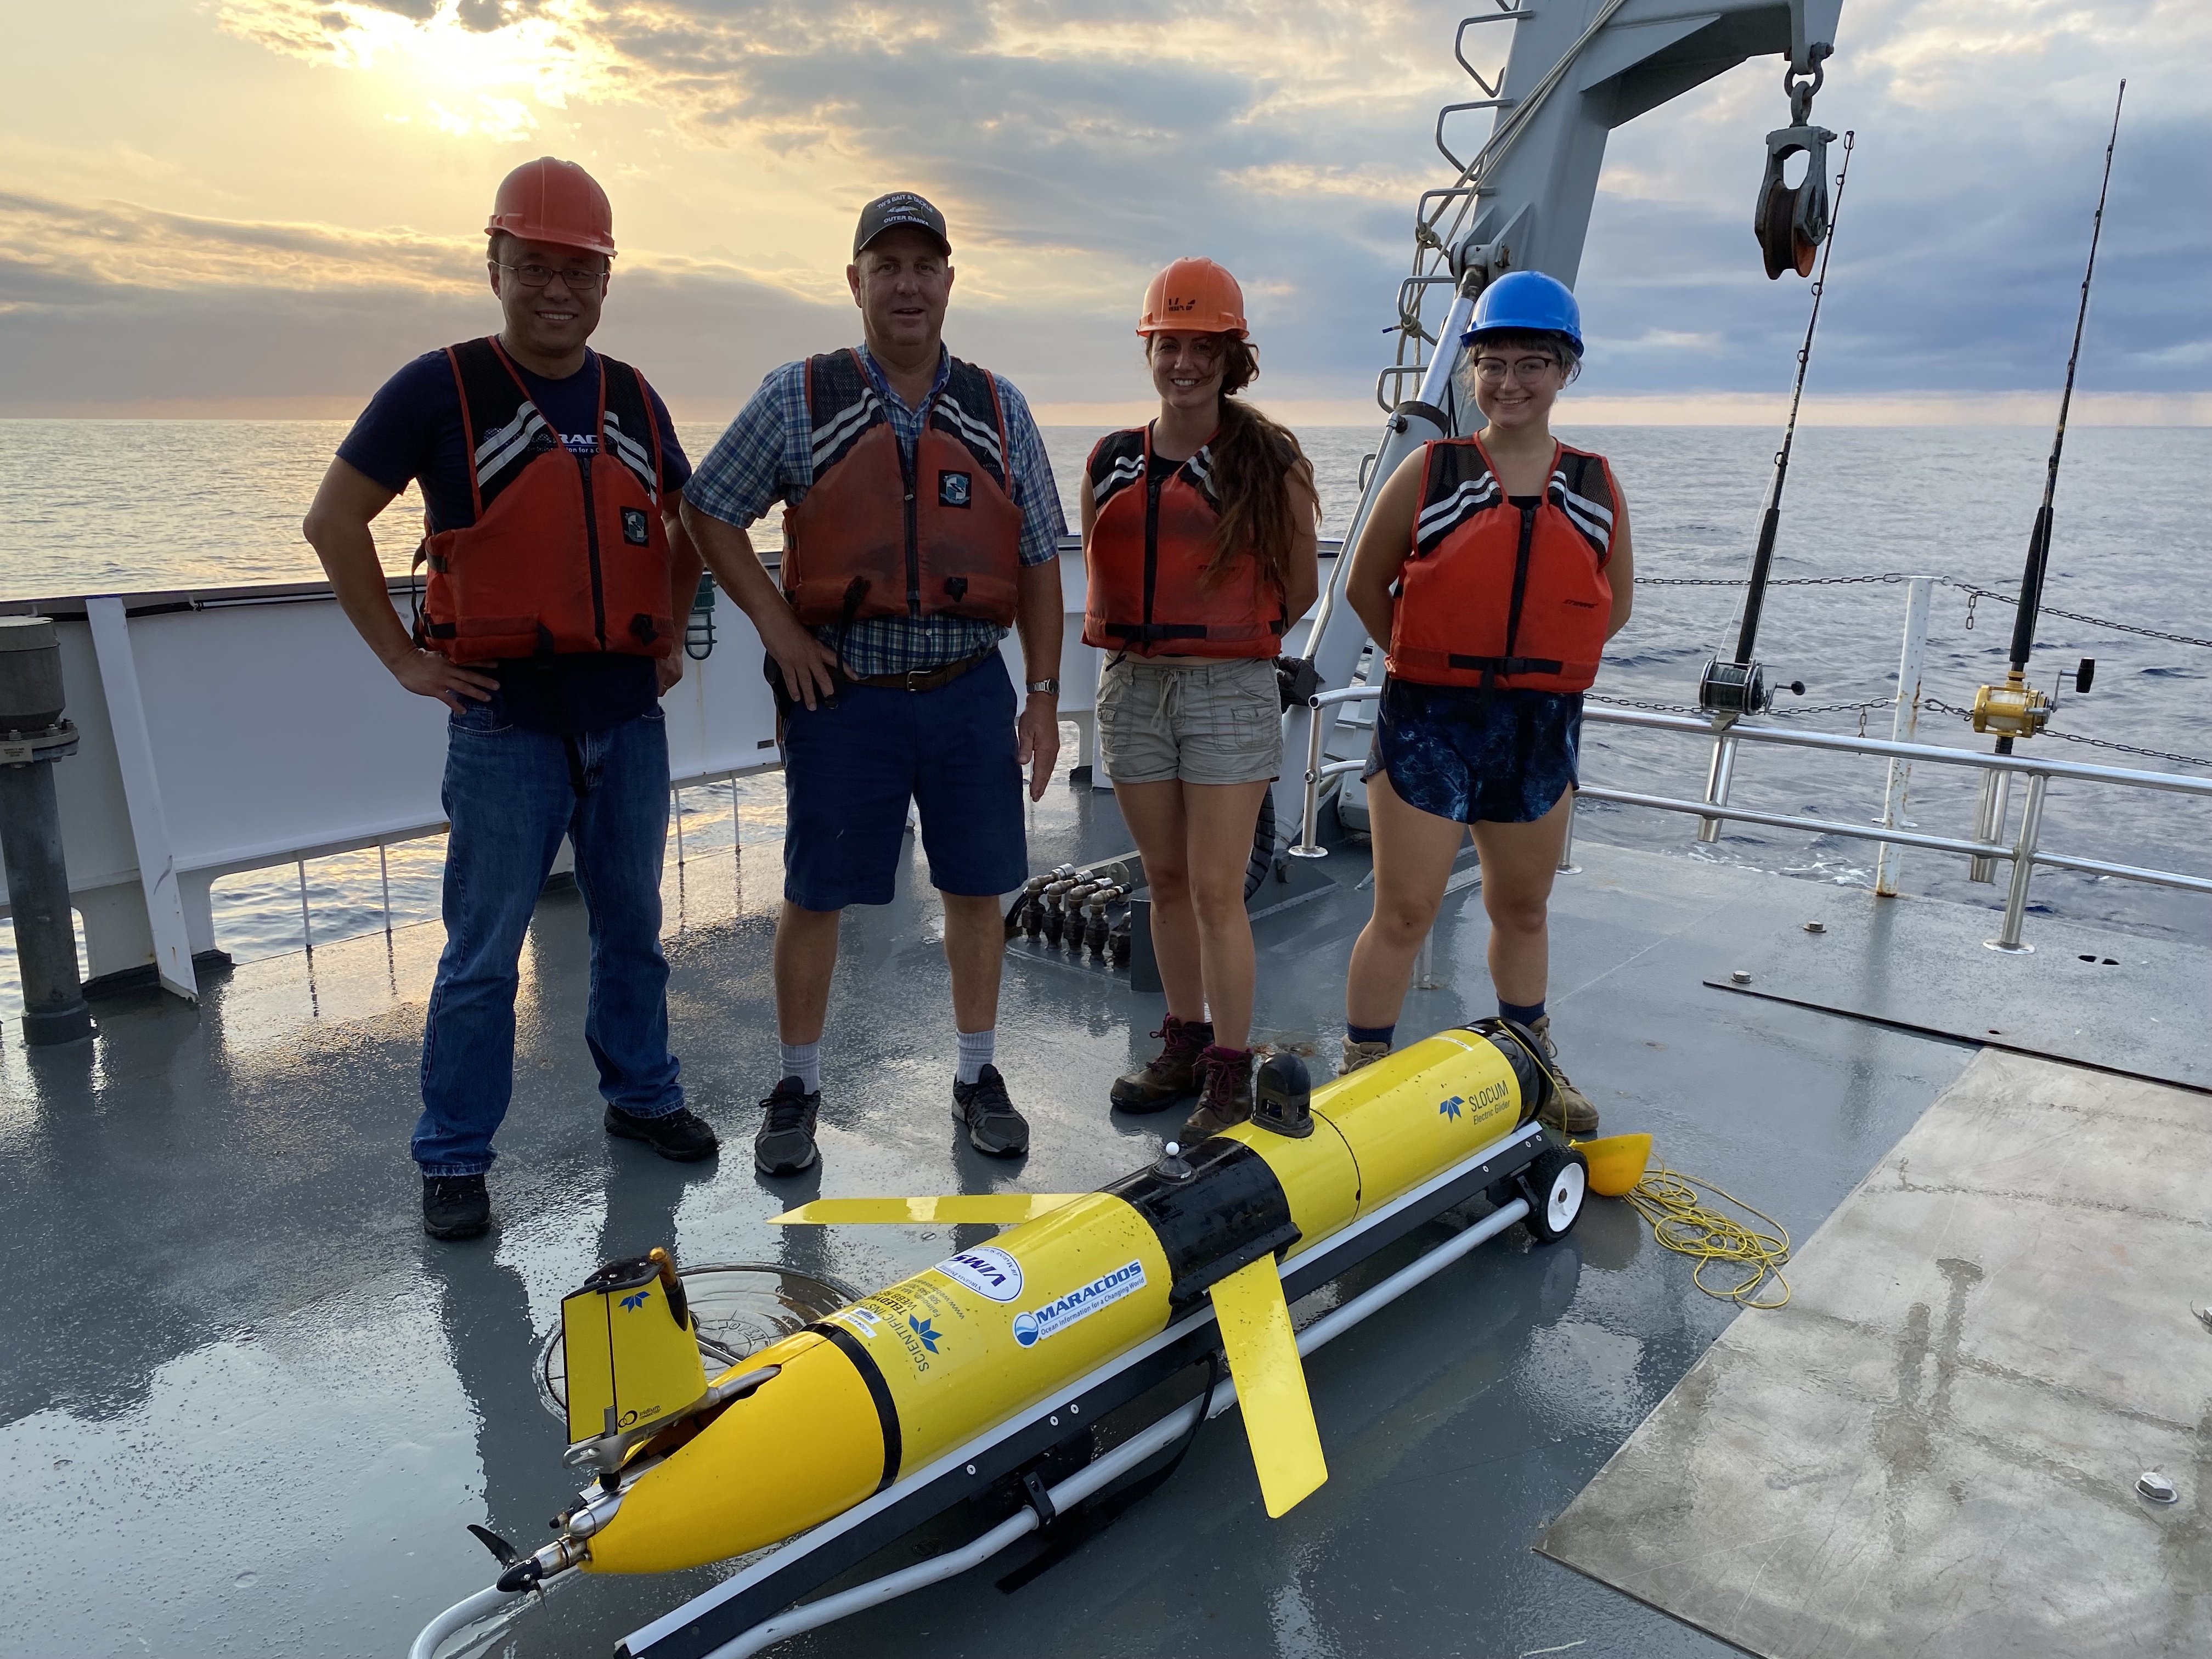
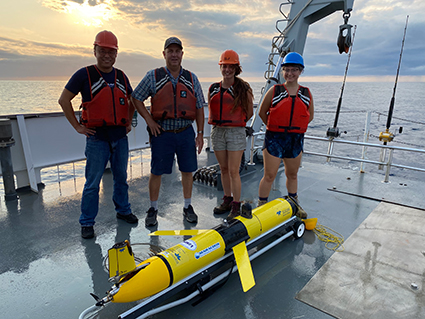
Navy gliders ready for deployment. Credit: USF.
NOAA IOOS: Glider Data Assembly Center
NOAA NHC: Official Forecasts
NOAA AOML: Glider Research | Map
CARICOOS: Hurricane Info
SECOORA: Hurricane info | Map
GCOOS: Hurricane info | Map
MARACOOS: Hurricane Info | Map
News / Press Releases


Videos


Images
Click on the thumbnail to view a full-size version.