 An official website of the United States government.
 Official websites use .gov
A .gov website belongs to an official government organization in the United States.
Official websites use .gov
A .gov website belongs to an official government organization in the United States.
 Secure .gov websites use HTTPS
A lock or https:// means you’ve safely connected to the .gov website. Share sensitive information only on official, secure websites.
Secure .gov websites use HTTPS
A lock or https:// means you’ve safely connected to the .gov website. Share sensitive information only on official, secure websites.
Integrated ocean data are enhancing scientific ability to forecast environmental changes and hazardous events, so decision makers can take targeted action, such as closing a beach to avoid illnesses caused by blooms of harmful algae. Hourly ocean temperatures, currents, and other data alert West Coast oyster growers and East Coast shellfish harvesters to conditions that trigger toxic algae outbreaks, which can make shellfish unsafe to eat.
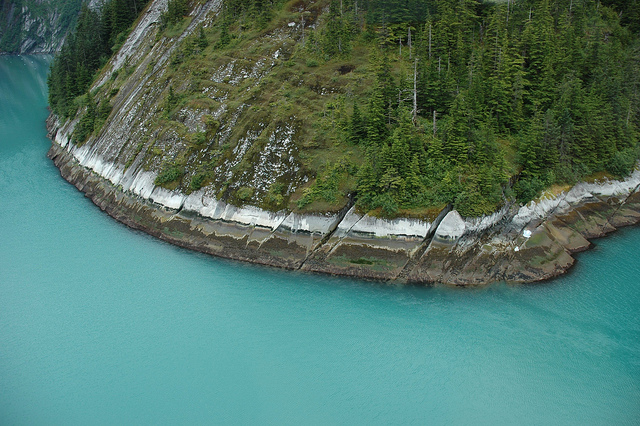
Aerial Photograph from Tracy Arm, AK showing erosion patterns in rockface NOAA/NMFS/AKFSC; Mandy Lindeberg
Rip currents are another coastal hazard that impact the nation. The National Weather Service ranks rip currents as the deadliest surf-related threat. The currents claim the lives of more than 100 people per year. The Mid-Atlantic is working to reduce that threat through public education and outreach efforts, as well as coastal radar and model forecasts to enhance rip tide detection and prediction. The region is working to product a daily surf zone advisory highlighting risk level. The system will provide 24 hour warnings and real-time updates so lifeguards can prepare for changing conditions. In the Caribbean, studies show 20-30 beachgoers each year lost their lives after succumbing to hard to predict rip currents. To address this problem, the IOOS region is developing rip current and beach safety data products. Scientists will provide the National Weather Service and municipal emergency management officers with current patterns at selected beaches identified through research and local stakeholder knowledge.
The list of coastal hazards that afflict our nation each year is long. In the Pacific Northwest, the economic value of timely, integrated data that are easy to access is showcased in its ports. The region is home to more than 20 ports that support industries such as commerce, fishing, transportation, security, and recreation. This region is also home to some of the nation’s most hazardous bar crossings. With vital West Coast ports connecting the U.S. with foreign markets and with a fishing industry worth roughly $800 million in personal income annually, there is a need for accurate and timely ocean observations and predictions. The regional IOOS supports commercial shipping by providing real-time wave information near the Columbia River bar—a key port entry point with potentially hazardous currents and large waves. To support the fishing industry, the Northwest Association of Networked Observing Systems developed a tool supplying nowcasts and forecasts of surface and bottom currents, temperature, and salinity along the Oregon coast. It is part of a suite of maps and data products allowing fishers to effectively and safely plan their trips. The page recorded more than 225 views per day during its first commercial fishing season between July and October of 2010.
The tsunami in Japan in March of 2011 is another example of IOOS data aiding safety and the economy. The Pacific Islands Ocean Observing System – a regional member of IOOS – provided the only real-time water level (tsunami arrival) and debris measurements for Waikiki at five locations. These data supported time-critical public safety measures like evacuation warnings and ongoing, real-time condition monitoring. The region’s website saw a ten-fold increase in website traffic corresponding with the passage of the tsunami waves through the region. The Northwest region of IOOS also observed a four-fold increase in web traffic and featured a Google Map-based application for the public and emergency planners at the top of its home page highlighting tsunami evacuation zones for the Oregon coast. Meanwhile, the Central and Northern California region experienced a five-fold increase in web traffic as they captured and displayed the tsunami passage in real time with sensors in Humboldt, San Francisco, Monterey, and Morro Bays. The region also displayed the tsunami inflows and outflows in real time via video cameras in Moss Landing and Santa Cruz harbors and provided information to the media and stakeholders. Not only did all of this information help keep people safe, it also provided warning to get property moved or stowed away to reduce economic hardships. Additionally, IOOS members in Southern California relied on pressure sensors to measure tsunami signals that they then released to the media and posted online. IOOS members in Alaska also posted wave height information online.
While tsunami waves are infrequent, coastal hazards around the country are not. Oregon and Washington states, for example, have some of North America’s most dynamic coastal landscapes, evident by their long wave-swept beaches, shear coastal cliffs, dramatic headlands and rugged vistas. Ultimately, the power of the Pacific Ocean shapes that landscape and creates hazards through flooding and erosion, seasonal changes in beach sand, interactions with man-made engineering structures, and, potentially, the coupled effects of an off-shore earthquake and subsequent tsunami. To adequately prepare and plan for such contingencies, the Northwest region of IOOS spearheaded the transfer of beach mapping techniques and technologies between the states of Washington and Oregon. This allows seamless data sharing so decision makers can better prepare for coastal hazard events that are not constrained by political boundaries. The IOOS region provides beach and nearshore observations and decision support tools for coastal managers, planners, community members and engineers. This improves planning and response to coastal hazards; assists engineering design; aids climate change research; and tracks shoreline change.
It’s a similar situation in the U.S. Pacific islands, which are vulnerable to hazards including sea level rise, coastal erosion and high wave events – such as tsunami and storm surge. These events pose an imminent threat to lives, property, and economic well-being. The region provides high water level and flooding predictions by developing maps of coastline change, identifying vulnerable areas, and providing beach condition forecasts. The region is also developing tools to improve predictions of hazardous events, thus creating a better prepared and more resilient coastal community. For example, IOOS members in the region and the University of Hawaii School of Ocean and Earth Science and Technology worked with state, county and local partners to develop a beach hazard rating system and information website for the State of Hawaii. Scientists use wave predictions and real-time wind observations from the National Weather Service and lifeguards to update hazard ratings three times a day. Divers, swimmers, paddlers, and others use this information to decide when the water is safe. Since its launch in May 2007, about 5,000-10,000 users visit the site each month.
Timely, integrated data that are easy to access also provide knowledge our decision makers need to take action for the environment. After a sewage spill, for example, IOOS data can track the probable path of the pollution so clean-up crews can get to the area faster.