 An official website of the United States government.
 Official websites use .gov
A .gov website belongs to an official government organization in the United States.
Official websites use .gov
A .gov website belongs to an official government organization in the United States.
 Secure .gov websites use HTTPS
A lock or https:// means you’ve safely connected to the .gov website. Share sensitive information only on official, secure websites.
Secure .gov websites use HTTPS
A lock or https:// means you’ve safely connected to the .gov website. Share sensitive information only on official, secure websites.
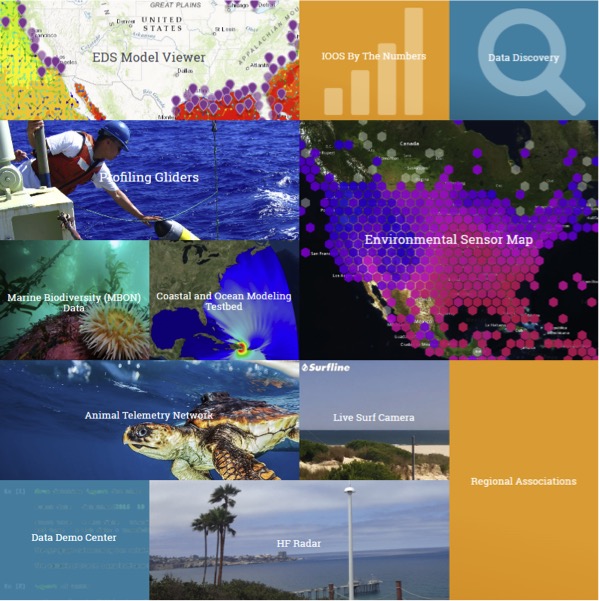
IOOS.us National Data Portal
IOOS data comes from a variety of technologies or data collection systems. While types of data available through any one of our 11 regional associations may vary depending on the local area, the national IOOS data products include data collected from buoys, high frequency radar systems and gliders. Modeling teams across regional associations also create data products including physical and environmental models of coastal systems.
IOOS data can be accessed through a variety of access services and tools through IOOS interactive maps, Data Assembly Centers (DACs), and individual Regional Association portals. This data access page provides an overview of all these services and tools as well as links to data usage demonstrations for scientists and managers looking to analyze data using various programing languages (Python, Matlab, R, etc).
Explore the IOOS.us National Data Portal
IOOS Data Products
The IOOS Catalog
 The IOOS Data Catalog is the master inventory of IOOS DMAC datasets and data access services. Users of the Catalog can do a plain text search to locate datasets of interest across the regions, and then connect to their associated data access services in their application of choice. The Catalog is powered by metadata, and allows users the ability to search for words or phrases within the metadata (eg. salinity observations) to locate relevant datasets. IOOS provides a number of data access service types, including Sensor Observation Service (SOS), OPeNDAP for gridded data and model output, and Open Geospatial Consortium WMS and WCS for use in GIS applications. Catalog users may vary in background and familiarity with the IOOS data access services; power users such as scientists, geospatial data analysts, or environmental managers may get the most from the Catalog, however tools to enable the casual user to visualize IOOS data from these services conveniently from within the Catalog are in the works.
The Environmental Sensor Map
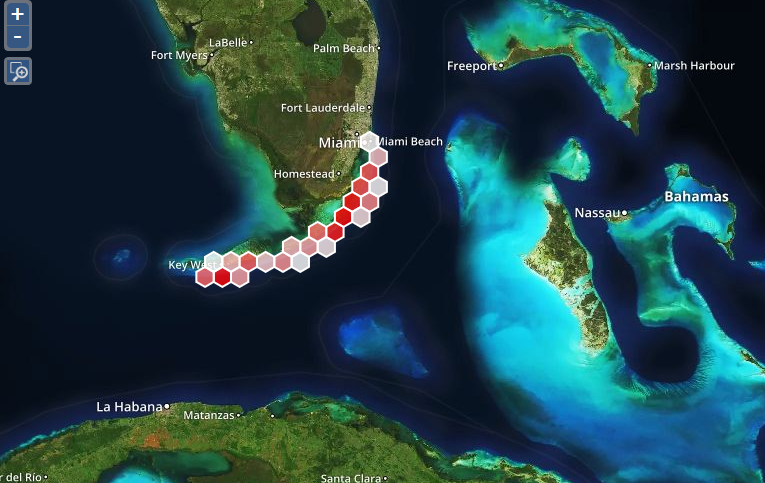
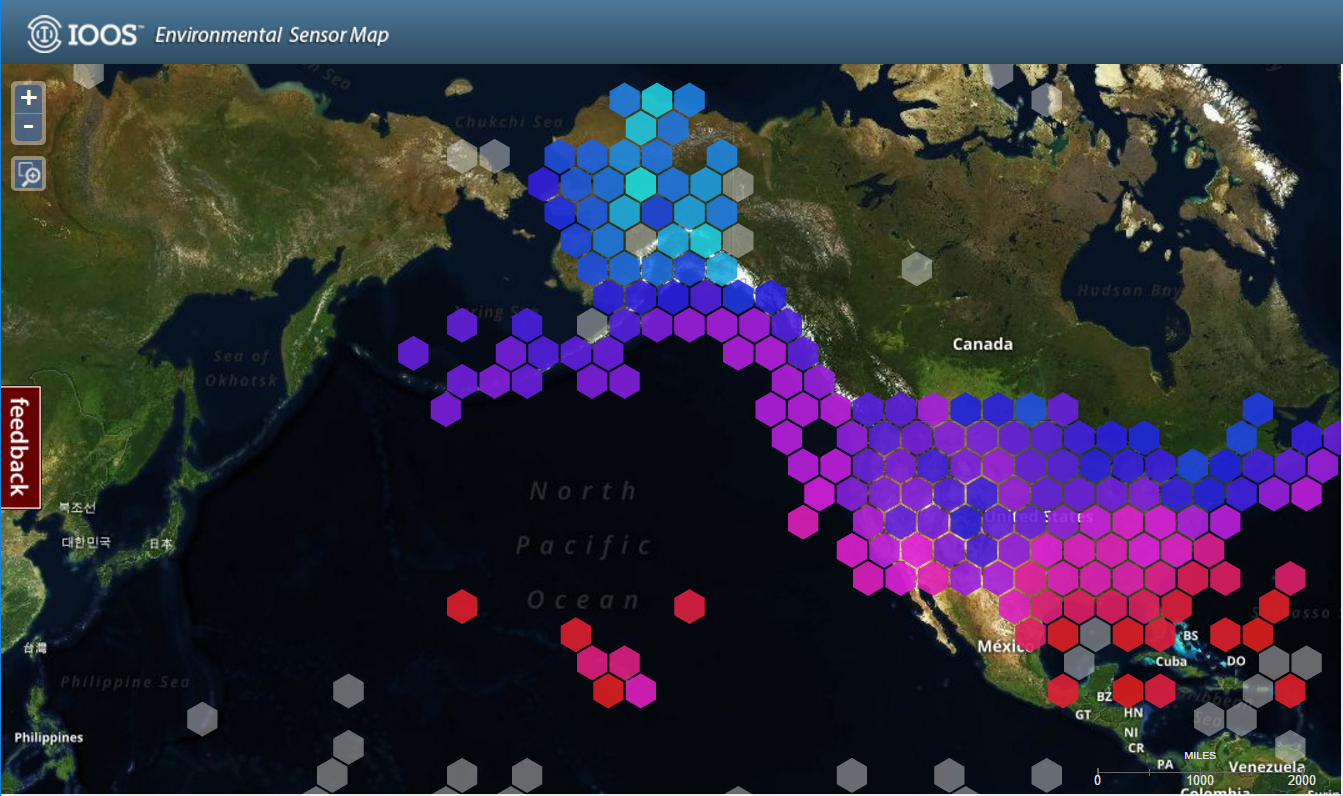 The Environmental Sensor Map integrates regional, national, and global real-time (past 4-hours) data across the IOOS enterprise. Data from observing systems operated by IOOS Regional Associations and local data providers within these regional footprints can be viewed and downloaded through this map. The map connects to over 32,000 stations providing the latest information on oceanographic and meteorological conditions. Individual stations and sensors can be selected when zoomed in. Data is obtained through various SOS access points. Dynamic graphs provide overview statistics for individual sensors or regions. The primary users of this map include Federal, State, and local marine scientists, coastal resource managers, and the general public.
IOOS Model Viewer
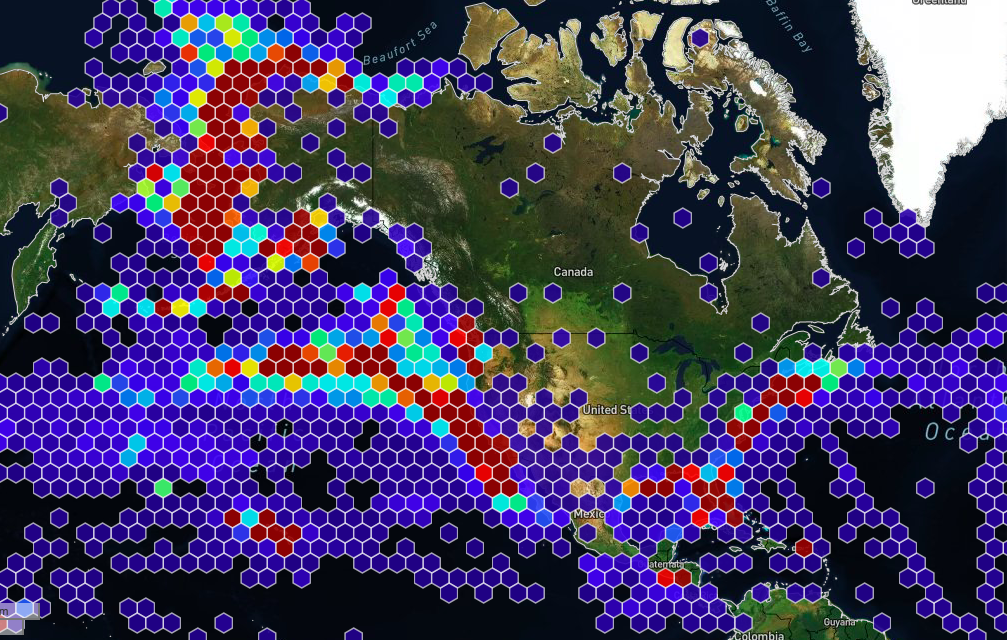
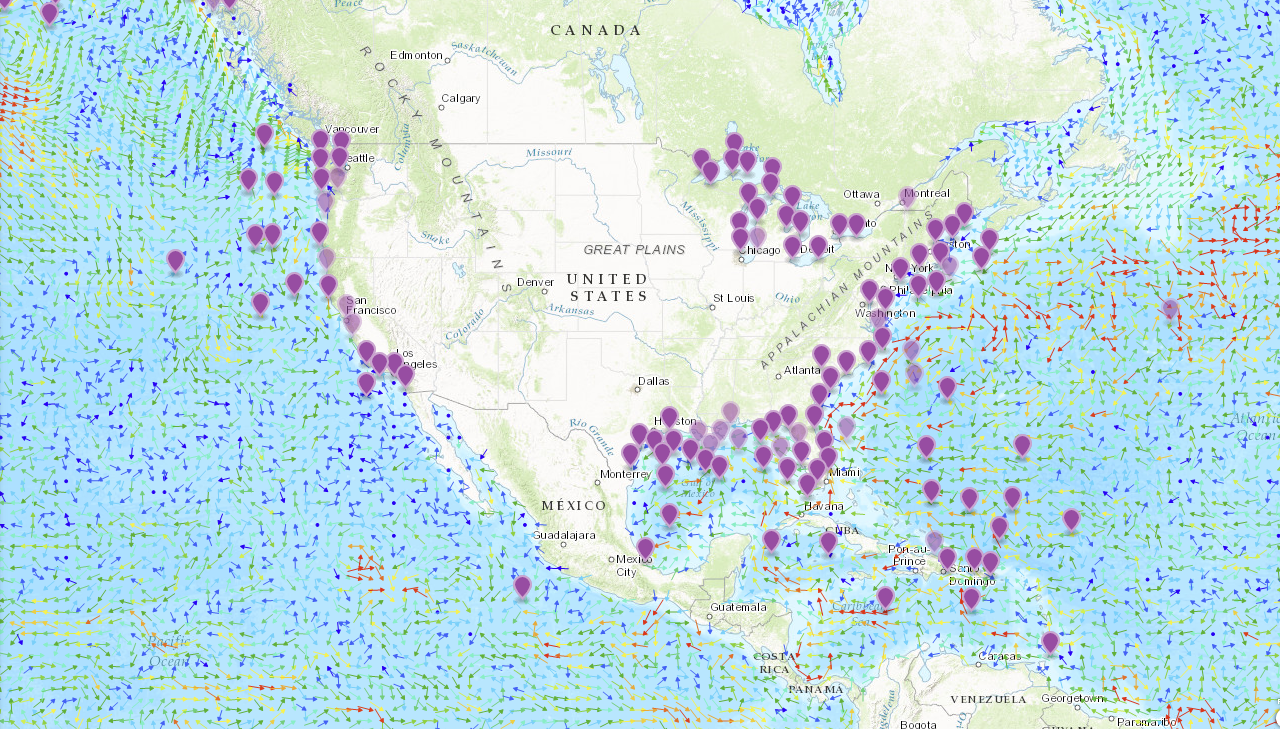 The IOOS Model Viewer provides a platform for visualization and analysis of integrated model output. Users can examine several modeled variables together in a map-based environment, and generate time-series plots of the output. Real-time observations are also available for comparison purposes. The engine driving this visualization is the Environmental Data Server (EDS), which harvests model output from a variety of disparate sources and normalizes the output into a single format: CF-compliant NetCDF. The EDS also provides data access services through a THREDDS server, which is available through the Viewer. This product is intended for use by the marine user community, though is open for exploration by the interested public.
Marine Biodiversity Observing Network Portal
 The MBON portal provides real-time, delayed-mode, and historical data for in situ and remotely-sensed physical, chemical and biological observations. Currently this beta site is under development, however, data access is offered through a series of web mapping services for each MBON project. The primary users include Federal, State, and local marine scientists, coastal resource managers but the general public is invited to explore. The data found in this portal focus on:
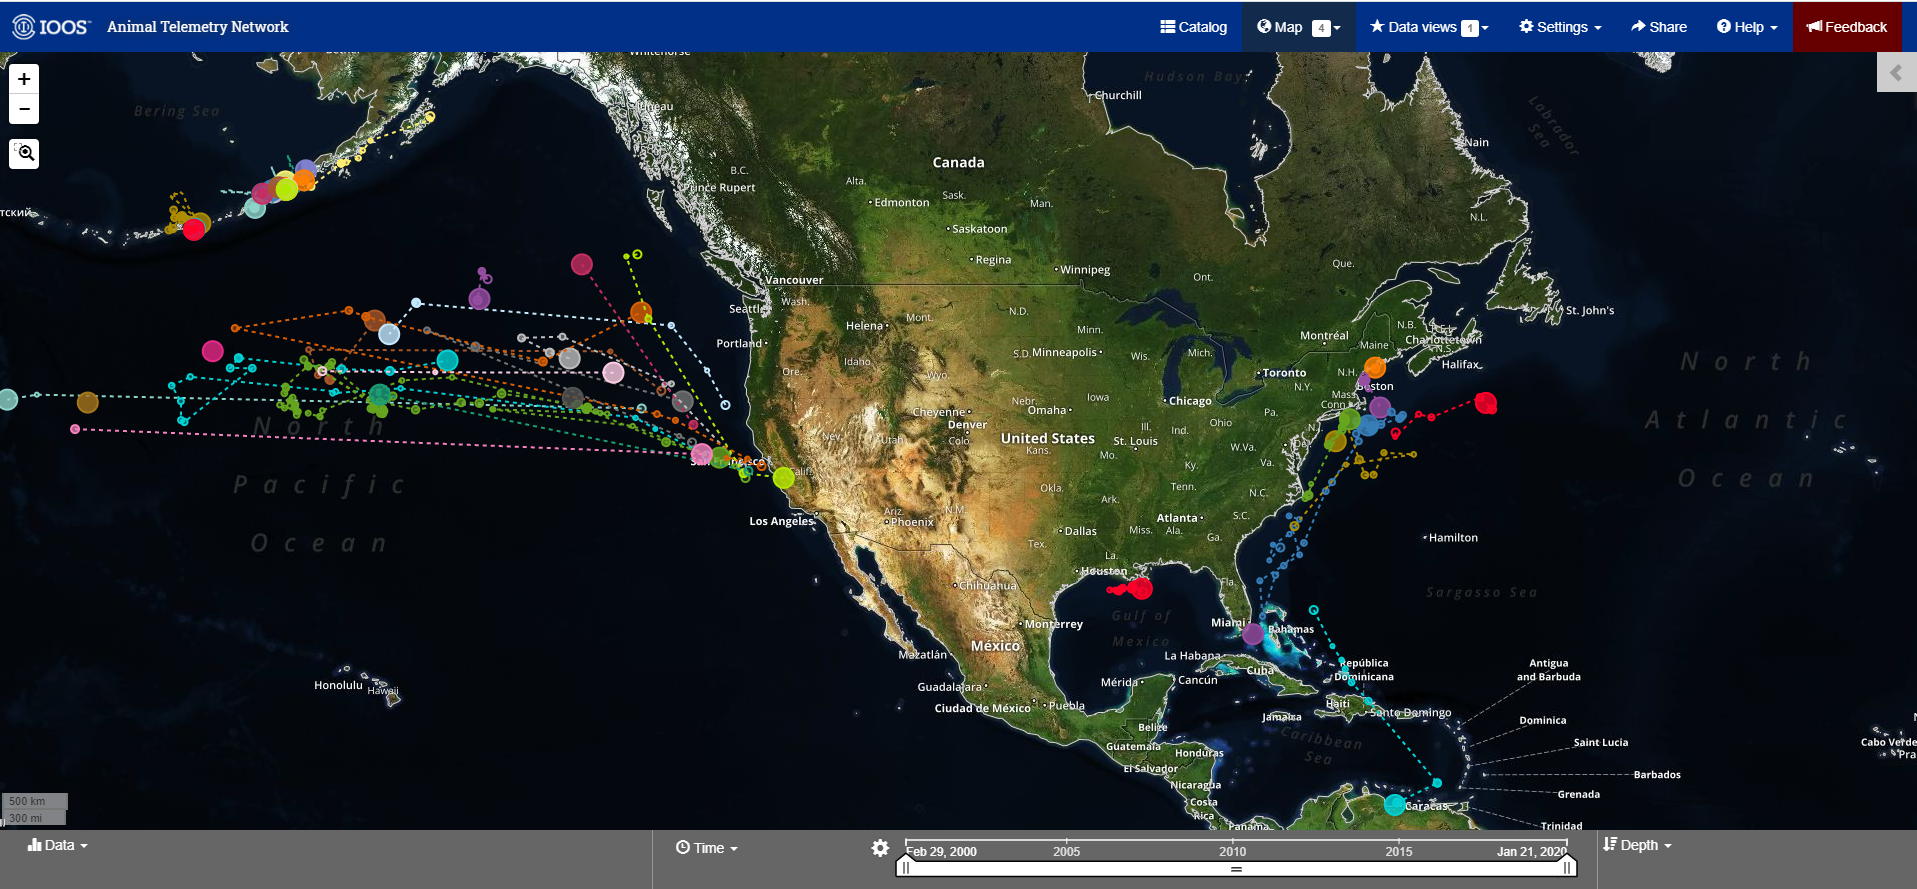
Animal Telemetry Network Data Portal
 The ATN data management vision includes a regionally distributed data collection, management and sharing capacity that builds on and integrates as many existing telemetry data links as possible to enable local and regional needs to be addressed. At the heart of this system is a centralized data assembly center (DAC) operated by Axiom Data Science. This DAC is a community resource where U.S animal telemetry data is aggregated in a single place where visualization of and access to the data is provided via the ATN Data Portal.
IOOS Data Assembly Centers
High Frequency Radar DAC
 The HF-radar network delivers surface current and wave data from U.S. waters to users nationwide and supports critical weather and marine forecasting operations at NOAA's NOAA's Office of Coast Survey, CO-OPS Tides & Currents, and Weather Forecasting Offices throughout the country. The HF-radar DAC offers access to near-real time data as hourly or 25-hour averaged surface currents on an interactive map. Scientists can also gain access to historical and near-real time data as NetCDF files on-demand via NDBC. Depending on the frequency range of the coastal stations, data are collected at a resolution ranging from 500 m to 6 km.
IOOS Underwater Glider DAC
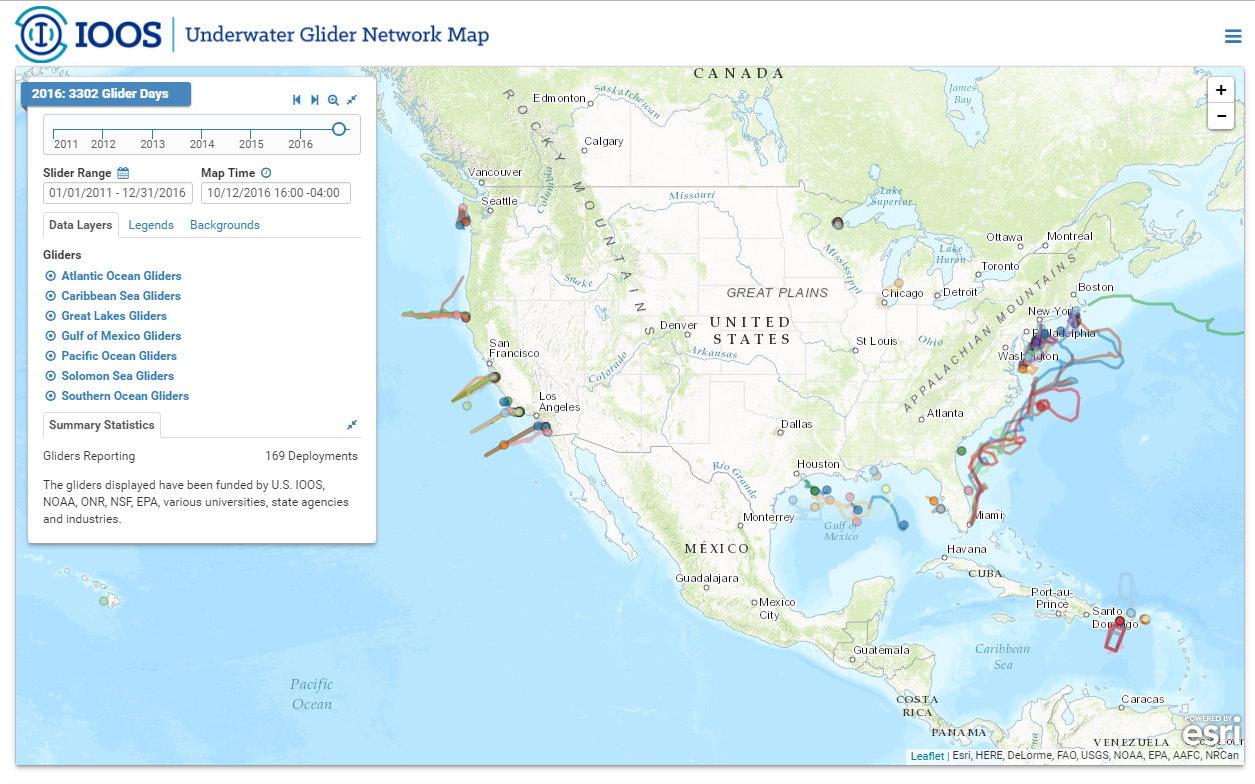 The mission of the Glider DAC is to provide glider operators with a simple process for submitting glider data sets to a centralized location, enabling the data to be visualized, analyzed, widely distributed via existing web services and the Global Telecommunications System (GTS) and archived at the National Centers for Environmental Information (NCEI).
Animal Telemetry Network DAC
 The ATN DAC is a centralized data assembly center to enable seamless data ingestion, storage, access and redistribution of U.S. national animal telemetry data and products. Once fully developed, the DAC will provide operational national capacity for secure and sustainable data management and display of marine animal telemetry data, as well as a data portal serving the public via U.S. IOOS standard services such as NOAA’s Environmental Research Division's Data Access Program (ERDDAP), Sensor Observation Service (SOS), or Web Map Services through OPeNDAP protocol. This DAC is designed to address the needs of Federal, State, and local marine scientists, coastal resource managers but the general public is welcome to explore the interactive features of this site.
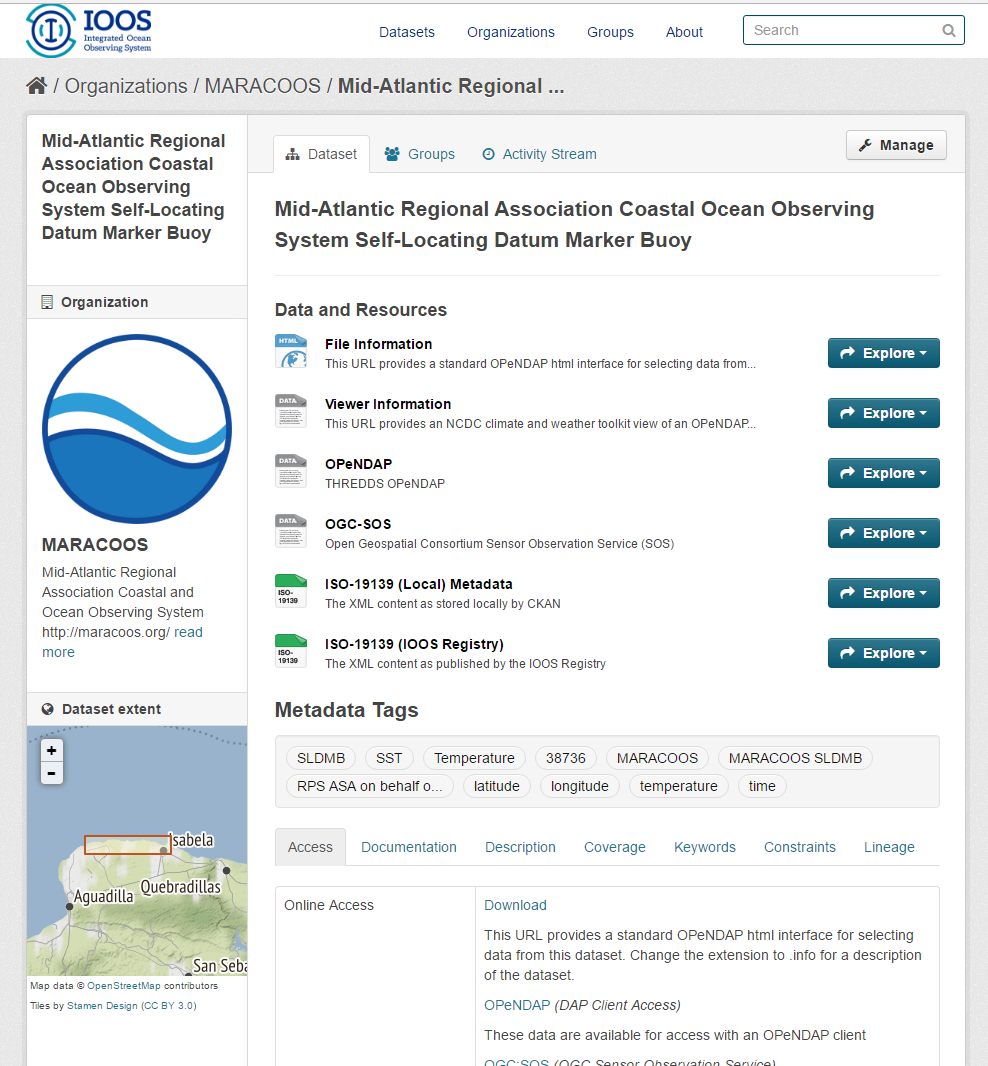
Regional Data Portals
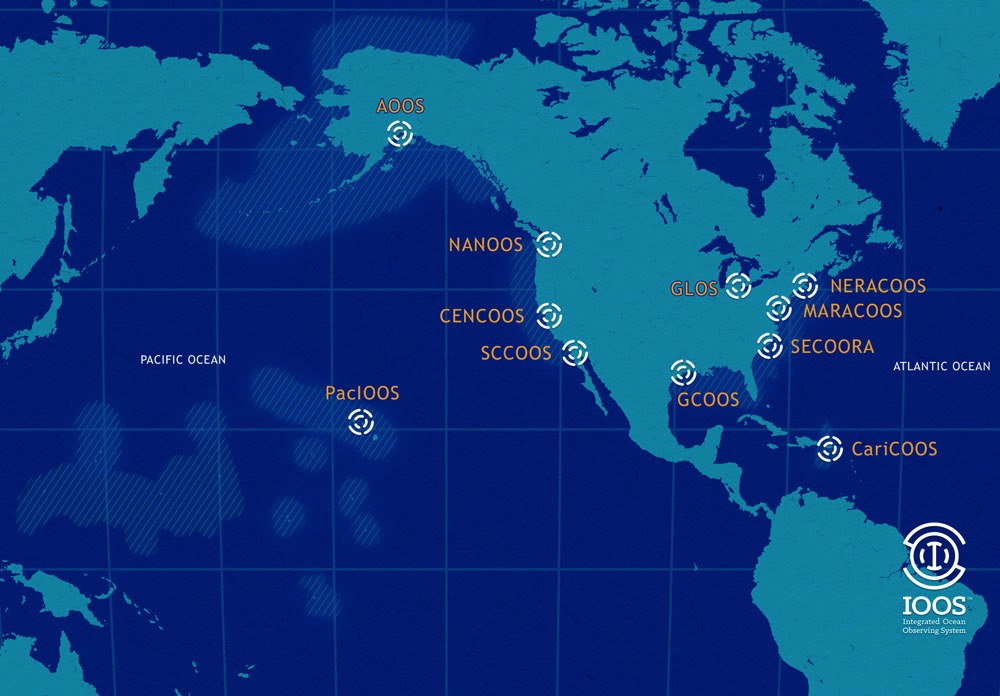 All 11 IOOS Regional Associations offer data collected in their region through their website data portals. The data offered at each portal is different and focuses on the regional associations specific strengths and local partnerships. For direct access to data in a particular region please visit the IOOS Regional Portal Map.
Resources
IOOS CodeLab
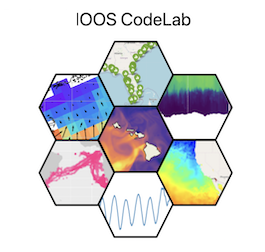 The IOOS CodeLab is a data usage blog designed as a technical resource for marine scientists. This site offers readers a suite of tutorials and examples to acquire and work with IOOS technologies and data sources. The blog offers Jupyter Notebook examples of Python, Matlab, and R code to access, analyze or display various IOOS data. Some posts are basic examples of code using IOOS data or products, others are more technical, offering demonstrations of new code packages or analysis techniques that community members have developed. The authors of these blog posts include both members of the IOOS program office staff and invited RA or partner scientists within the IOOS community. On this blog scientists can also find links to RA data portal video tutorials and other video presentations made by IOOS partners.
Additional Resources
To learn more about the different servers and technologies that operate “under the hood” of IOOS, please explore the IOOS Github Pages
If you are new to accessing data off a THREDDS, the Ocean Observatories Initiative (OOI) offers a step-by-step tutorial on how to browse a THREDDS server which some users may find helpful.
To learn more about metadata, NCEI has a helpful website where you can find more information.