 An official website of the United States government.
 Official websites use .gov
A .gov website belongs to an official government organization in the United States.
Official websites use .gov
A .gov website belongs to an official government organization in the United States.
 Secure .gov websites use HTTPS
A lock or https:// means you’ve safely connected to the .gov website. Share sensitive information only on official, secure websites.
Secure .gov websites use HTTPS
A lock or https:// means you’ve safely connected to the .gov website. Share sensitive information only on official, secure websites.
For forecasts, warnings, and up to the minute hurricane information, keep up with NOAA's National Hurricane Center.
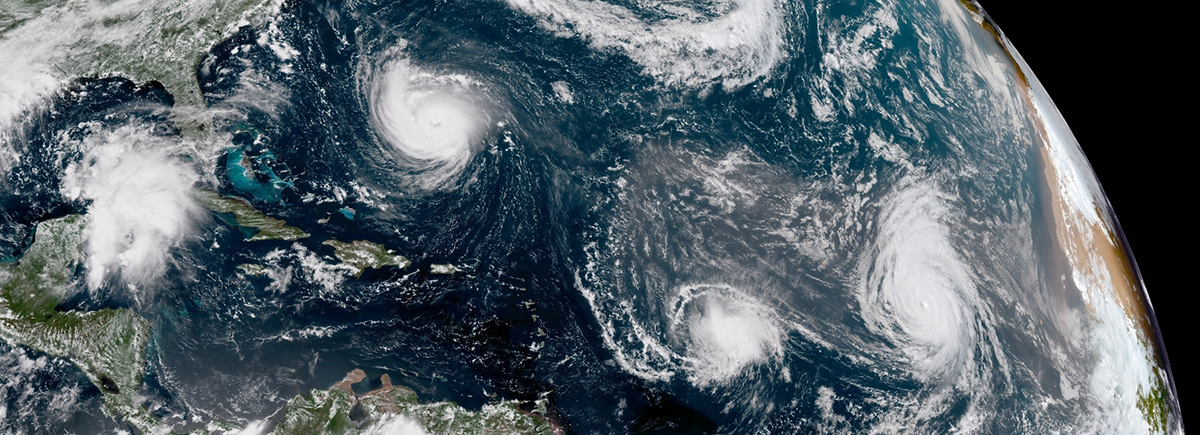
GOES East GeoColor satellite image of the Atlantic Ocean on September 11, 2018 showing Hurricanes Florence (L) and Helene (R) and Tropical Storm Isaac (center). Photo Credit: NOAA/NESDIS
Ocean observations are important elements of forecasting, tracking, and managing risk during hurricane season. The resources listed here will provide you with visualizations, data portals, forecasting information, and more.
For forecasts, warnings, and up to the minute hurricane information, keep up with NOAA's National Hurricane Center.
National Resources
IOOS.us provides quick access to U.S. IOOS's main project areas, including the data catalog for data downloads. During hurricane season, the following tools can be used to access key storm tracking data:
The U.S. IOOS Glider Data Assembly Center ingests data from gliders deployed throughout all U.S. IOOS regions, and includes data from NOAA gliders as well as RA gliders, U.S. Navy gliders, and more. Gliders are customized to gather an array of measurements, which often includes sea surface temperature and salinity, which are important to storm prediction and forecasting.
The Environmental Sensor Map integrates regional, national, and global real-time (past 4-hours) data gathered by sensors on buoys and fixed moorings from a broad spectrum of local and national resources throughout the U.S. Custom data views are offered during or after notable events, and users can create and save their own data views on demand.
The EDS Model Viewer is tool that can be used to examine, analyze, and access integrated model output from federal and non-federal partners. Users can examine several modeled variables together in a map-based environment, and generate time-series plots of the output. Real-time observations are also available for comparison purposes.
Regional Resources
Mid-Atlantic - MARACOOS
Visit the MARACOOS Storm Resource Center to access the MARACOOS OceansMap for data visualizations (and download the mobile app) as well as links to neighboring regions and national information centers.
Southeast - SECOORA
SECOORA' s Hurricane Resource dashboard offers quick access to the data portal, buoy & high-frequency radar data as well as links to forecasting, storm surge modeling, and more. For storms poised to affect the SECOORA region, they also create custom “Eyes on the Storm” dashboards that include dedicated ocean data including highest wind speeds, wave heights, and lowest barometric pressure in the vicinity of the storm; glider data; custom data views; and available web cameras.
A unique network called WebCOOS (The Webcams for Coastal Observations and Operational Support) has multiple webcams stationed along the southeast coast and is operated by SECOORA and partners with funding from NOAA. These cameras can offer recent and up-to-the-minute views of coastal conditions before, during, and after hurricane passage.
Gulf of Mexico - GCOOS
GCOOS created a Hurricane resource center, gathering access to forecast information, satellite images, external resources, and emergency contacts. The tabbed, comprehensive dashboard provides weather radar mosaics, satellite cloud imagery, maps of specific storm warning and watch areas (for wind, flood, flash flood, lightning, tornado, and marine) and maps of any hurricanes or storms in the Gulf of Mexico, with their observed tracks, and forecasted positions out to three and five days.
Caribbean - CARICOOS
CARICOOS has a suite of data visualizations on their Hurricane Season dashboard. View water and heat visualizations, satellite imagery, and forecasts focusing on the Caribbean.
Pacific Islands - PacIOOS
PacIOOS Voyager has a variety of data to offer for hurricane season. To view (an active) projected cone, "Hurricanes and tropical cyclones" can be selected under the "Hazards: Forecast" category. As a storm is approaching, you might be interested to find out about NOAA's satellite sea surface temperatures, the forecasted wave height from PacIOOS models, or the actual observed wave heights from NOAA NDBC and PacIOOS wave buoys during the storm. To monitor rain, precipitation measured by Doppler Radar might be of interest to you, as well as observations from USGS rain gauges and stream gauges. And of course, last but not least, wind forecasts can be accessed through the Pacific NOAA GFS layer or PacIOOS' high resolution atmospheric model for the Hawaiian Islands. Note that the views in the links provided above will zoom into the Hawaiian Islands by default; users can pan or zoom to other regions of the Pacific to view some of our similar tools and data for American Samoa, Guam, Commonwealth of the Northern Mariana Islands, Republic of the Marshall Islands, Federated States of Micronesia, and the Republic of Palau. Model offerings vary by location and not all forecasts or datasets are available in each location.